The post Pi Network (PI) Price Rises Again—What’s Behind Today’s Move? appeared first on Coinpedia Fintech News Pi Network’s native token, PI, is gaining short-term traction as buyers return after a muted week of consolidation. Over the past 24 hours, the Pi price has pushed higher, holding above its key intraday support and showing fresh signs of accumulation. While the move isn’t explosive, it stands out during a period when several altcoins …The post Pi Network (PI) Price Rises Again—What’s Behind Today’s Move? appeared first on Coinpedia Fintech News Pi Network’s native token, PI, is gaining short-term traction as buyers return after a muted week of consolidation. Over the past 24 hours, the Pi price has pushed higher, holding above its key intraday support and showing fresh signs of accumulation. While the move isn’t explosive, it stands out during a period when several altcoins …

Pi Network (PI) Price Rises Again—What’s Behind Today’s Move?

2025/11/20 01:25
Pi Network News: Why Pi Coin Can Hit $3 And Above

The post Pi Network (PI) Price Rises Again—What’s Behind Today’s Move? appeared first on Coinpedia Fintech News

Pi Network’s native token, PI, is gaining short-term traction as buyers return after a muted week of consolidation. Over the past 24 hours, the Pi price has pushed higher, holding above its key intraday support and showing fresh signs of accumulation. While the move isn’t explosive, it stands out during a period when several altcoins remain largely flat.

PI Price Action in the Last 24 Hours

PI climbed modestly in the past day as traders reacted to improving market sentiment and a clear defense of the $0.22–$0.23 support area. The price fluctuated within a tight range but gradually trended upward, reflecting controlled buying interest rather than speculative volatility.

Market activity also picked up, with trading volumes improving after a period of unusually thin liquidity. This suggests that traders are positioning early for a possible short-term breakout if momentum continues to build.

Why PI Is Rising Today

The past 24 hours highlight a few clear catalysts:

● Buyers absorbed every minor dip: Retail and mid-sized traders stepped in aggressively around the $0.225 zone, signalling strong short-term confidence. This “dip-buying” behaviour has supported PI’s steady upward grind.

● Bullish sentiment returns as consolidation tightens: PI has been in a narrowing price structure for several days. Momentum indicators are beginning to turn upward, suggesting the token may be preparing for a broader breakout attempt if volume sustains.

● Improving micro-sentiment around utility development: Discussions within the community about Pi Network’s progress toward open-mainnet readiness have resurfaced, helping fuel positive bias. While these developments are long-term in nature, they often spark short-term price reactions.

Pi Price Analysis: Key Levels Traders Are Watching

pi price
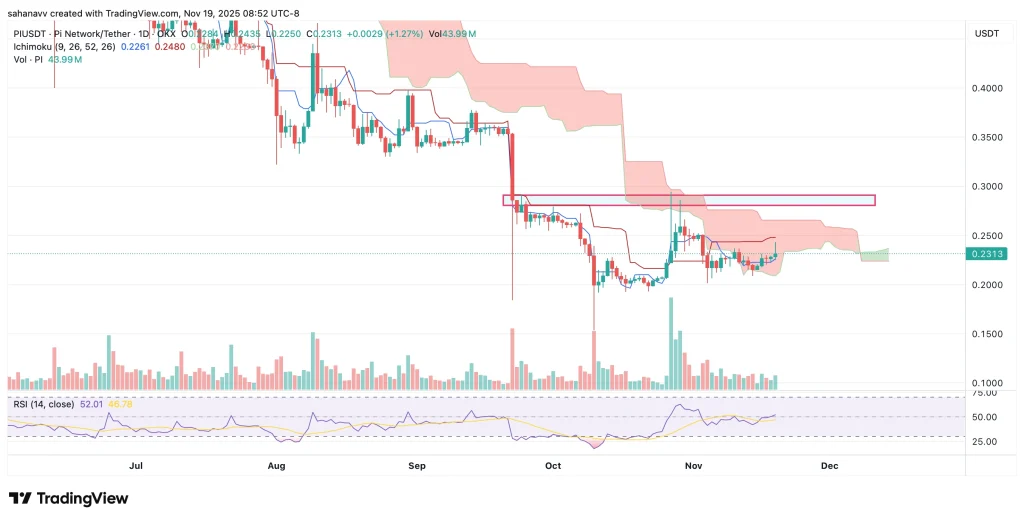
  • The PI price has entered a consolidation phase as the price has entered the Ichimoku cloud, while conversion & base lines are heading for a bullish crossover
  • Besides, the RSI has been maintaining a decent ascending trend, which is expected to complete the parabolic curve, forming a W-shaped or double-bottom pattern 
  • Short-Term Resistance is around $0.28 – a break above this region could accelerate the bullish momentum, with the Immediate Support: $0.217

For now, PI remains in a fragile but improving short-term uptrend. A sustained move above resistance would signal a stronger shift in sentiment, potentially inviting more speculative inflows.

Outlook for PI in November

The next 24–48 hours are likely to determine whether this bounce turns into a structured trend. If buying pressure continues to increase and PI clears its overhead resistance, the token could reclaim higher ranges sooner than expected. But a failure to break out may result in another sideways phase, especially if broader market conditions soften.

Disclaimer: The articles reposted on this site are sourced from public platforms and are provided for informational purposes only. They do not necessarily reflect the views of MEXC. All rights remain with the original authors. If you believe any content infringes on third-party rights, please contact [email protected] for removal. MEXC makes no guarantees regarding the accuracy, completeness, or timeliness of the content and is not responsible for any actions taken based on the information provided. The content does not constitute financial, legal, or other professional advice, nor should it be considered a recommendation or endorsement by MEXC.

You May Also Like

Dogecoin’s Strongest Support Zone Revealed—Here’s The Level

Dogecoin’s Strongest Support Zone Revealed—Here’s The Level

A cryptocurrency analyst has revealed where the most significant Dogecoin support level is located, according to on-chain cost basis data. Dogecoin CBD Points To $0.08 As Strongest Support In a new post on X, analyst Ali Martinez has talked about how Dogecoin support is looking from the perspective of the Cost Basis Distribution (CBD). The CBD is an indicator created by on-chain analytics firm Glassnode that tells us about the amount of DOGE supply that was last purchased or transacted at the various price levels that the coin has visited in its history. Generally, investors are sensitive to retests of their cost basis and can be prone to showing some kind of reaction during one. The more holders that have their cost basis at the same level, the larger the market reaction upon a retest. Thus, the levels that the CBD identifies as being dense with supply could potentially be significant ones for the cryptocurrency. Related Reading: Bitcoin Short-Term Holders Panic: 65,200 BTC Sent To Exchanges At Loss Now, here is the chart shared by Martinez that shows the trend in the Dogecoin CBD over the past couple of years: As displayed in the above graph, a major Dogecoin cost basis level is located around $0.20, hosting the break-even level of 12.1 billion DOGE. The latest bearish momentum, however, has meant that the memecoin has plunged under this mark, putting all these investors into a state of loss. Underwater holders may look forward to a retest of their cost basis so that they can exit with their entire investment back. This can make large supply zones above the asset’s price potential resistance barriers. Considering that the $0.20 level is so huge, it’s possible that DOGE may find notable impedance at it, should a retest take place in the near future. In the scenario that Dogecoin continues to decline, it might have to find support at a major cost basis center below. Such investors who were in profit prior to the retest may decide to buy more at their break-even level, thinking it to be a profitable entry point to accumulate more. From the chart, it’s visible that at the levels below, there aren’t any large cost basis zones until all the way down to $0.08, implying support may be thin for the asset. Related Reading: XRP, Bitcoin Now In “Good Buy Zone,” Says Analytics Firm The $0.08 level, though, is extraordinary in the amount of supply that it hosts the acquisition point of: 27.4 billion DOGE. The analyst has noted that this makes the line DOGE’s “most significant support level.” It now remains to be seen how Dogecoin will develop in the near term and whether a retest of one of the big cost basis centers will take place. DOGE Price At the time of writing, Dogecoin is trading around $0.158, down 10% over the last week. Featured image from Dall-E, Glassnode.com, chart from TradingView.com
Share
NewsBTC2025/11/20 12:00
XRP Price Weakens Again, Key Demand Area Tested After Steady Downmove

XRP Price Weakens Again, Key Demand Area Tested After Steady Downmove

XRP price started a fresh decline below $2.150. The price is now attempting to recover and faces resistance near the $2.15 pivot level. XRP price started a fresh decline below the $2.10 zone. The price is now trading below $2.150 and the 100-hourly Simple Moving Average. There is a bearish trend line forming with resistance at $2.150 on the hourly chart of the XRP/USD pair (data source from Kraken). The pair could continue to move down if it settles below $2.020. XRP Price Faces Resistance XRP price attempted a recovery wave above $2.20 but failed to continue higher, like Bitcoin and Ethereum. The price started a fresh decline below $2.150 and $2.120. There was a move below the $2.050 support level. A low was formed at $2.025, and the price is now attempting a recovery wave. There was a move toward the 23.6% Fib retracement level of the downward move from the $2.525 swing high to the $2.025 low. The price is now trading below $2.150 and the 100-hourly Simple Moving Average. If there is a fresh upward move, the price might face resistance near the $2.140 level. There is also a bearish trend line forming with resistance at $2.150 on the hourly chart of the XRP/USD pair. The first major resistance is near the $2.20 level. A close above $2.20 could send the price to $2.250. The next hurdle sits at $2.2750 or the 50% Fib retracement level of the downward move from the $2.525 swing high to the $2.025 low. A clear move above the $2.2750 resistance might send the price toward the $2.320 resistance. Any more gains might send the price toward the $2.350 resistance. The next major hurdle for the bulls might be near $2.420. Another Drop? If XRP fails to clear the $2.150 resistance zone, it could start a fresh decline. Initial support on the downside is near the $2.050 level. The next major support is near the $2.020 level. If there is a downside break and a close below the $2.020 level, the price might continue to decline toward $1.9650. The next major support sits near the $1.920 zone, below which the price could continue lower toward $1.880. Technical Indicators Hourly MACD – The MACD for XRP/USD is now losing pace in the bearish zone. Hourly RSI (Relative Strength Index) – The RSI for XRP/USD is now above the 50 level. Major Support Levels – $2.050 and $2.020. Major Resistance Levels – $2.150 and $2.250.
Share
NewsBTC2025/11/20 12:08