The post Is Altcoin Season Starting? Analyst Says ETH/BTC Chart Mirrors 2017 Bull Run appeared first on Coinpedia Fintech News Altcoins may be entering their strongest phase in years, and one analyst believes the charts are already giving early warnings. Popular crypto analyst Moustache has pointed to a rare ETH/BTC signal that has marked the start of every major altcoin boom since 2017.  This same signal has just appeared again, and the market may be …The post Is Altcoin Season Starting? Analyst Says ETH/BTC Chart Mirrors 2017 Bull Run appeared first on Coinpedia Fintech News Altcoins may be entering their strongest phase in years, and one analyst believes the charts are already giving early warnings. Popular crypto analyst Moustache has pointed to a rare ETH/BTC signal that has marked the start of every major altcoin boom since 2017.  This same signal has just appeared again, and the market may be …

Is Altcoin Season Starting? Analyst Says ETH/BTC Chart Mirrors 2017 Bull Run

2025/12/09 19:24
Is Altcoin Season 2025 Dead or Delayed

The post Is Altcoin Season Starting? Analyst Says ETH/BTC Chart Mirrors 2017 Bull Run appeared first on Coinpedia Fintech News

Altcoins may be entering their strongest phase in years, and one analyst believes the charts are already giving early warnings. Popular crypto analyst Moustache has pointed to a rare ETH/BTC signal that has marked the start of every major altcoin boom since 2017. 

This same signal has just appeared again, and the market may be waking up at the perfect time.

Classic ETH/BTC Signal Just Flashed Again

According to Moustache, the start of an altcoin season often shows up when the SMA100 crosses below the EMA100 on the ETH/BTC chart. This crossover has now happened once more. 

In every previous cycle, this same move triggered long altcoin rallies, including the strong 2020–2021 run.

ETH/BTC chart

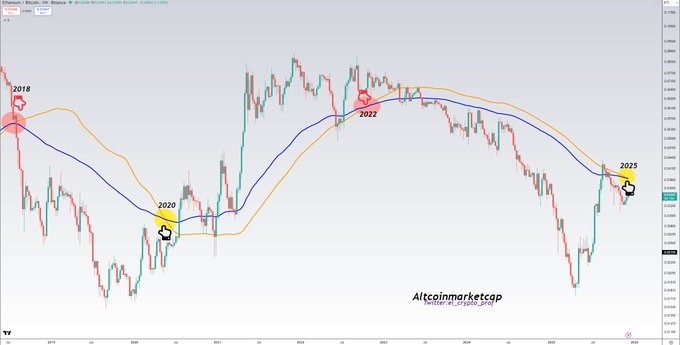
What makes this moment even more interesting is that ETH/BTC has broken a 3.5-month downtrend, which often signals money rotating from Bitcoin into altcoins. When ETH gains strength against BTC, altcoins typically follow with even bigger moves.

Institutional Rotation into Altcoins Has Already Started

The charts are not the only indication. Real-world activity is now matching the technical signals.

Institutions have already begun rotating into altcoins. Coinpedia recently reported that two major players, Amber Group and Metalapha, quietly withdrew 9,000 ETH worth over $28 million from Binance in just a few hours.

This is part of a much bigger trend. Over the last five months, large investors have accumulated nearly 4 million ETH.

At the same time, capital is flowing into other top altcoins. XRP ETFs saw $38.04 million in net inflows, followed by Ethereum ETFs with $35.49 million and Solana ETFs with $1.18 million.

Meanwhile, Bitcoin ETFs posted $60.48 million in net outflows, showing a clear shift of attention away from BTC.

MACD and a 4.5-Year Wedge Add to the Bullish Case

Moustache also highlights the MACD on ETH/BTC, which now mirrors previous reversal patterns. Each time this setup appeared, Ethereum led the market into a new altcoin boom.

Even larger is the giant falling wedge on the ETH/BTC macro chart, which has been forming for 4.5 years. If this wedge breaks, it could lift the entire altcoin market, not just Ethereum.

Timeline for Altcoin to begin Rally?

With the same historical signals flashing again, institutions shifting money into altcoins, Moustache believes the altcoin bull market may already be quietly starting, and 2026 could be the year when altcoins see a major rally.

Meanwhile, Crypto Total Market Cap excluding Bitcoin is now hovering around $1.24 trillion. 

Disclaimer: The articles reposted on this site are sourced from public platforms and are provided for informational purposes only. They do not necessarily reflect the views of MEXC. All rights remain with the original authors. If you believe any content infringes on third-party rights, please contact [email protected] for removal. MEXC makes no guarantees regarding the accuracy, completeness, or timeliness of the content and is not responsible for any actions taken based on the information provided. The content does not constitute financial, legal, or other professional advice, nor should it be considered a recommendation or endorsement by MEXC.

You May Also Like

Edges higher ahead of BoC-Fed policy outcome

Edges higher ahead of BoC-Fed policy outcome

The post Edges higher ahead of BoC-Fed policy outcome appeared on BitcoinEthereumNews.com. USD/CAD gains marginally to near 1.3760 ahead of monetary policy announcements by the Fed and the BoC. Both the Fed and the BoC are expected to lower interest rates. USD/CAD forms a Head and Shoulder chart pattern. The USD/CAD pair ticks up to near 1.3760 during the late European session on Wednesday. The Loonie pair gains marginally ahead of monetary policy outcomes by the Bank of Canada (BoC) and the Federal Reserve (Fed) during New York trading hours. Both the BoC and the Fed are expected to cut interest rates amid mounting labor market conditions in their respective economies. Inflationary pressures in the Canadian economy have cooled down, emerging as another reason behind the BoC’s dovish expectations. However, the Fed is expected to start the monetary-easing campaign despite the United States (US) inflation remaining higher. Investors will closely monitor press conferences from both Fed Chair Jerome Powell and BoC Governor Tiff Macklem to get cues about whether there will be more interest rate cuts in the remainder of the year. According to analysts from Barclays, the Fed’s latest median projections for interest rates are likely to call for three interest rate cuts by 2025. Ahead of the Fed’s monetary policy, the US Dollar Index (DXY), which tracks the Greenback’s value against six major currencies, holds onto Tuesday’s losses near 96.60. USD/CAD forms a Head and Shoulder chart pattern, which indicates a bearish reversal. The neckline of the above-mentioned chart pattern is plotted near 1.3715. The near-term trend of the pair remains bearish as it stays below the 20-day Exponential Moving Average (EMA), which trades around 1.3800. The 14-day Relative Strength Index (RSI) slides to near 40.00. A fresh bearish momentum would emerge if the RSI falls below that level. Going forward, the asset could slide towards the round level of…
Share
BitcoinEthereumNews2025/09/18 01:23