A Storm Is Coming and Bear May Follow, Expert Says
Bitcoin is in an uptrend, the bull is still running, but a bear confirmed entry, and an explosive storm may be on its way, according to Tony Severino, market analyst at fintech platform YouHodler. Ethereum is weak compared to Bitcoin, but this is about to change. At the same time, 2026 will be a massive year, perhaps BTC’s “most decisive” yet.
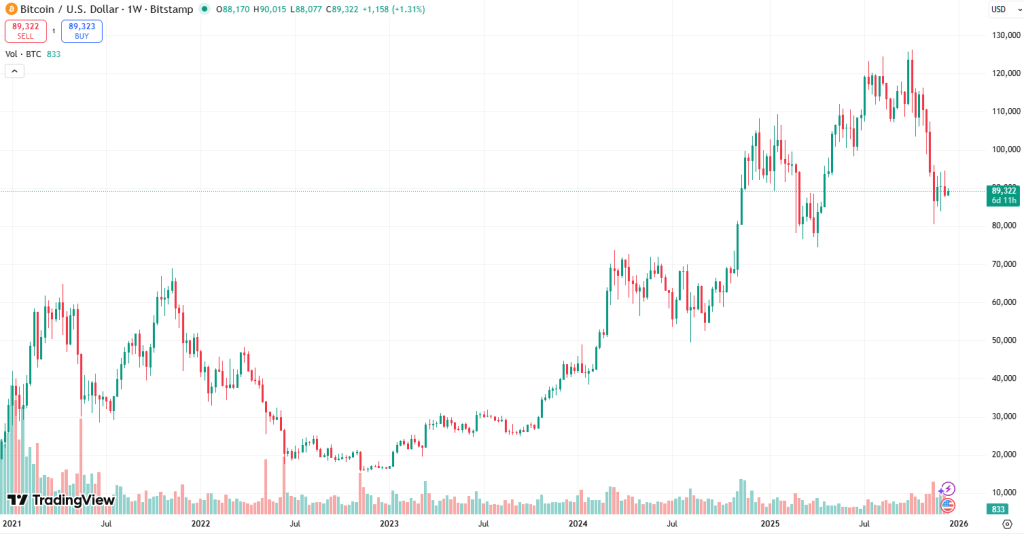
According to Severino, Bitcoin is, by definition, still in an uptrend.
Yet, overhead resistance is stacked. Bitcoin could try to reclaim the 50-week moving average, which sits at some $102,000.
Then, $100,000 will act as a key psychological barrier, and this makes it “an ideal zone for a bull trap.” A move above $100,000 “could embolden bulls with a ‘we’re so back’ mentality.” But this could “blind them to a potential reversal back down to new lows,” Severino says.
He argues that,
A Bear Is Here
Importantly, Q1 2026 will be critical. Per the analyst, it will “show us the way for the rest of the year.”
Given the high timeframe momentum and four-year-cycle timing and dynamics, he argues, “there is a higher probability that Bitcoin is entering a bear market.”
Therefore, it’s likely that BTC will fail to reclaim $100,000. This would indicate “that the bull market is indeed over.”
To confirm a downtrend and change into a bear market, the coin would need to confirm “a lower low.” Therefore, $74,000 becomes a critical support zone that bulls must defend to keep BTC bullish.
Falling below this zone would confirm the bear market. The next downside target would then sit around $53,000.
“At that point, higher timeframe technical indicators would reach levels oversold enough to begin to consider a true bear market bottom is in,” he says.
At the same time, Severino discussed the key technical indicators he’s paying attention to. Per his email, these are all related to momentum. And momentum persists, he says. “Even when a car hits its brakes to avoid an accident, strong enough momentum could push the vehicle towards a crash. It will take time for bearish momentum to turn bullish.”
As an example, the analysts provided the six-week LMACD (Logarithmic Moving Average Convergence Divergence). This technical indicator confirmed a bearish crossover, he says. It takes 200-365 on average between the signal and a bottom, as well as up to 860 days between a bearish and a bullish crossover.
“I’d have to begin to see the monthly LMACD lines converge and close in on a bullish crossover before I’d consider a bear market thesis invalidated,” Severino says.
Four-Year-Cycle Under Microscope
“Make no mistake, 2026 will be Bitcoin’s most decisive year yet,” Severino says. “2025 was characterized by confusion” due to macro backdrop uncertainty and Donald Trump’s “tariff tantrums.”
Moreover, Bitcoin’s 2025 yearly candlestick will close as a Doji. This is typically a pause in a trend. Therefore, either a reversal or strong continuation will follow it.
“Simply put, Bitcoin will prove the four-year-cycle remains with a bear market, or break the cyclical pattern with a renewed bull run.”
 Source: Tradingview
At the same time, “a storm is coming.”
Volatility is stirring on the lowest timeframes. Yet, higher timeframes show an “unusually calm” market. “A spark is waiting to ignite this compression into an explosion,” the analyst argues.
Ethereum Could Be The Decision Maker
Ethereum remains relatively weak compared to Bitcoin, Severino says. However, the analyst says, “this is about to change dramatically.”
The ETHBTC pair shows a reversal: ETH could be outperforming BTC in the longer term.
However, Severino cautious that if the cryptocurrency market enters a downtrend and bear market, this outperformance could be associated with ETHUSD holding better than BTCUSD, rather than ETHUSD growing faster than BTCUSD.
Yet, this BTC-ETH “mismatch” should present many favourable trading opportunities even in the bear market.
 Source: Tradingview
Finally, the ETH/BTC ratio may show a potential capital rotation into Ethereum.
Several events could dampen BTC and raise ETH. These include a BTC-related catalyst pushing sentiment down, or ETH being far more oversold than BTC. The latter may see Bitcoin reset while Ethereum continues the foundation building phase.
Therefore, “if Ethereum can revitalize crypto market sentiment, it may finally create the perfect storm situation for an unexpected altcoin season,” Severino concludes. “If Ethereum’s strength fails to ignite interest in altcoins, we may be witnessing the market purging projects without true potential.”
You May Also Like
Ripple to Expand $1.3 Billion RLUSD Stablecoin to Ethereum Layer-2 Networks

SEC Chair Calls for Privacy Protection Amid Growing Crypto Oversight