

Bitcoin Cash (BCH) Price Prediction 2026, 2027-2030
- Bullish BCH price prediction for 2026 is $669.2 to $982.3.
- Bitcoin Cash (BCH) price might reach $1500 soon.
- Bearish BCH price prediction for 2026 is $288.0.
In this Bitcoin Cash (BCH) price prediction 2026, 2027-2030, we will analyze the price patterns of BCH by using accurate trader-friendly technical analysis indicators and predict the future movement of the cryptocurrency.
|
TABLE OF CONTENTS
|
|
INTRODUCTION
|
|
|
BITCOIN CASH (BCH) PRICE PREDICTION 2026
|
|
| BITCOIN CASH (BCH) PRICE PREDICTION 2027, 2028-2030 |
| CONCLUSION |
| FAQ |
Bitcoin Cash (BCH) Current Market Status
| Current Price | $638.04 |
| 24 – Hour Price Change | 0.91% Up |
| 24 – Hour Trading Volume | $405.23M |
| Market Cap | $12.75B |
| Circulating Supply | 19.97M BCH |
| All – Time High | $4,355.62 (On Dec 20, 2017) |
| All – Time Low | $75.08 (On Dec 15, 2018) |
What is Bitcoin Cash (BCH)
| TICKER | BCH |
| BLOCKCHAIN | Bitcoin Cash |
| CATEGORY | Altcoin |
| LAUNCHED ON | August 2017 |
| UTILITIES | Governance, security, gas fees & rewards |
Bitcoin Cash is a peer-to-peer electronic money system that aims to become a trusted global currency with fast payments, micro-commissions, privacy, and high transaction capacity. Just as physical money, such as dollar bills, is transferred directly to the recipient, Bitcoin Cash payments are sent directly from person to person.
Bitcoin Cash (BCH) is a form of cryptocurrency very similar to Bitcoin. In fact, Bitcoin Cash is a fork of Bitcoin due to the split of the chain where a certain group of Bitcoin developers is not satisfied with the general direction of Bitcoin’s scalability.
Bitcoin Cash 24H Technicals
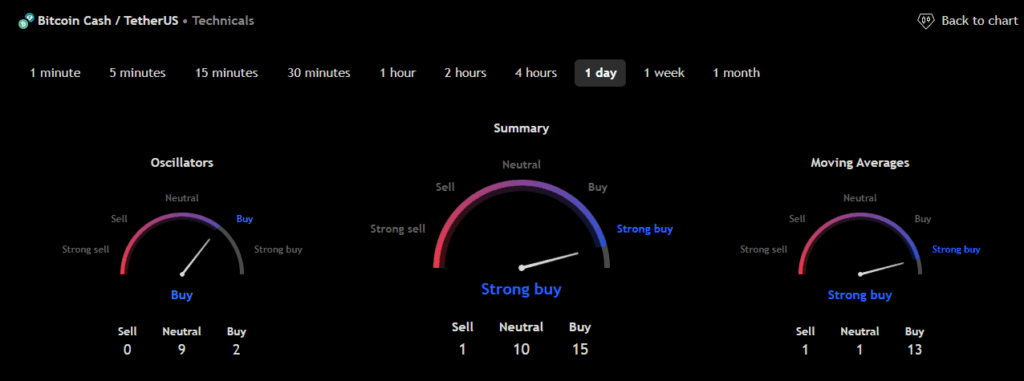 (Source: TradingView)
Bitcoin Cash (BCH) Price Prediction 2026
Bitcoin Cash (BCH) ranks 11th on CoinMarketcap in terms of its market capitalization. The overview of the Bitcoin Cash price prediction for 2026 is explained below with a daily time frame.
In the above chart, Bitcoin Cash (BCH) laid out an Horizontal channel pattern. The Horizontal channel pattern is also known as the sideways trend. In general, the horizontal channel is formed during the price consolidation. In this pattern, the upper trendline, the line that connects the highs, and the lower trendline, the line that connects the lows, run horizontally parallel, and the price action is contained within it.
A horizontal channel is often regarded as one of the suitable patterns for timing the market, as the buying and selling points are in consolidation.
At the time of analysis, the price of Bitcoin Cash (BCH) was recorded at $638.04. If the pattern trend continues, then the price of BCH might reach the resistance levels of $664.5 and $709.8. If the trend reverses, then the price of BCH may fall to the support of $643.1 and $621.9.
Bitcoin Cash (BCH) Resistance and Support Levels
The chart given below elucidates the possible resistance and support levels of Bitcoin Cash (BCH) in 2026.
From the above chart, we can analyze and identify the following as the resistance and support levels of Bitcoin Cash (BCH) for 2026.
| Resistance Level 1 | $669.2 |
| Resistance Level 2 | $982.3 |
| Support Level 1 | $442.5 |
| Support Level 2 | $288.0 |
BCH Resistance & Support Levels
Bitcoin Cash (BCH) Price Prediction 2026 — RVOL, MA, and RSI
The technical analysis indicators such as Relative Volume (RVOL), Moving Average (MA), and Relative Strength Index (RSI) of Bitcoin Cash (BCH) are shown in the chart below.
From the readings on the chart above, we can make the following inferences regarding the current Bitcoin Cash (BCH) market in 2026.
| INDICATOR | PURPOSE | READING | INFERENCE |
| 50-Day Moving Average (50MA) | Nature of the current trend by comparing the average price over 50 days | 50 MA = $580.6Price = $632.6 (50MA < Price) | Bullish/Uptrend |
| Relative Strength Index (RSI) | Magnitude of price change;Analyzing oversold & overbought conditions | 58.2 <30 = Oversold 50-70 = Neutral>70 = Overbought | Neutral |
| Relative Volume (RVOL) | Asset’s trading volume in relation to its recent average volumes | Below cutoff line | Weak Volume |
Bitcoin Cash (BCH) Price Prediction 2026 — ADX, RVI
In the below chart, we analyze the strength and volatility of Bitcoin Cash (BCH) using the following technical analysis indicators — Average Directional Index (ADX) and Relative Volatility Index (RVI).
From the readings on the chart above, we can make the following inferences regarding the price momentum of Bitcoin Cash (BCH).
| INDICATOR | PURPOSE | READING | INFERENCE |
| Average Directional Index (ADX) | Strength of the trend momentum | 31.1 | Strong Trend |
| Relative Volatility Index (RVI) | Volatility over a specific period | 47.27 <50 = Low >50 = High | Low Volatility |
Comparison of BCH with BTC, ETH
Let us now compare the price movements of Bitcoin Cash (BCH) with that of Bitcoin (BTC), and Ethereum (ETH).
From the above chart, we can interpret that the price action of BCH is similar to that of BTC and ETH. That is, when the price of BTC and ETH increases or decreases, the price of BCH also increases or decreases respectively.
Bitcoin Cash (BCH) Price Prediction 2027, 2028 – 2030
With the help of the aforementioned technical analysis indicators and trend patterns, let us predict the price of Bitcoin Cash (BCH) between 2027, 2028, 2029, and 2030.
| Year | Bullish Price | Bearish Price |
| Bitcoin Cash (BCH) Price Prediction 2027 | $2000 | $130 |
| Bitcoin Cash (BCH) Price Prediction 2028 | $2500 | $120 |
| Bitcoin Cash (BCH) Price Prediction 2029 | $3000 | $110 |
| Bitcoin Cash (BCH) Price Prediction 2030 | $3500 | $100 |
Conclusion
If Bitcoin Cash (BCH) establishes itself as a good investment in 2026, this year would be favorable to the cryptocurrency. In conclusion, the bullish Bitcoin Cash (BCH) price prediction for 2026 is $982.3. Comparatively, the bearish Bitcoin Cash (BCH) price prediction for 2026 is $288.0.
If there is a positive elevation in the market momentum and investors’ sentiment, then Bitcoin Cash (BCH) might hit $1500. Furthermore, with future upgrades and advancements in the Bitcoin Cash ecosystem, BCH might surpass its current all-time high (ATH) of $4,355.62 and mark its new ATH.
FAQ
1. What is Bitcoin Cash (BCH)?
Bitcoin Cash is a peer-to-peer electronic money system that aims to become a trusted global currency with fast payments, micro-commissions, privacy, and high transaction capacity.
2. Where can you buy Bitcoin Cash (BCH)?
Bitcoin Cash (BCH) has been listed on many crypto exchanges which include Binance, BlueBit, OKX, Bybit, Zedcex Exchange, and more.
3. Will Bitcoin Cash (BCH) record a new ATH soon?
With the ongoing developments and upgrades within the Bitcoin Cash platform, Bitcoin Cash (BCH) has a high possibility of reaching its ATH soon.
4. What is the current all-time high (ATH) of Bitcoin Cash (BCH)?
Bitcoin Cash (BCH) hit its current all-time high (ATH) of $4,355.62 on Dec 20, 2017.
5. What is the lowest price of Bitcoin Cash (BCH)?
According to CoinMarkBCHap, BCH hit its all-time low (ATL) of $75.08 on Dec 15, 2018.
6. Will Bitcoin Cash (BCH) hit $1500?
If Bitcoin Cash (BCH) becomes one of the active cryptocurrencies that majorly maintain a bullish trend, it might rally to hit $1500 soon.
7. What will be the Bitcoin Cash (BCH) price by 2027?
Bitcoin Cash (BCH) price might reach $2000 by 2027.
8. What will be the Bitcoin Cash (BCH) price by 2028?
Bitcoin Cash (BCH) price might reach $2500 by 2028.
9. What will be the Bitcoin Cash (BCH) price by 2029?
Bitcoin Cash (BCH) price might reach $3000 by 2029.
10. What will be the Bitcoin Cash (BCH) price by 2030?
Bitcoin Cash (BCH) price might reach $3500 by 2030.
Top Crypto Predictions
Uniswap (UNI) Price Prediction
Polkadot (DOT) Price Prediction
Internet Computer (ICP) Price Prediction
Disclaimer: The opinion expressed in this chart is solely the author’s. It does not represent any investment advice. TheNewsCrypto team encourages all to do their own research before investing.
You May Also Like

Teledyne Advances U.S. National Defense with Multiple Awards for SDA’s Tranche 3 Tracking Layer Program
The Rise of Secure Digital Payments in a Cashless Economy
