

“There is no fix” for the U.S. debt, says ex-Coinbase CTO Balaji Srinivasan — and it’s starting to show
Is the U.S. quietly heading toward a soft default, not through missed payments, but via inflation and currency erosion, just as Srinivasan warns?
Table of Contents
- The $175 trillion problem no one wants to touch
- Worst H1 for the dollar in 50 years
- Print and inflate, or pay and stagnate
- Bitcoin, gold, and hard-capped assets
The $175 trillion problem no one wants to touch
On the surface, America’s official debt stands at around $36.2 trillion, according to the U.S. Treasury’s latest June 2025 update. But former CTO of Coinbase Balaji Srinivasan believes that is just the beginning.
In a post on X dated Jul. 1, he pointed to a far larger number, $175 trillion, arguing that when future promises like Social Security, Medicare, and public pensions are included, the country’s true financial obligations are much higher than the headline figures suggest.
The long-term view is based on estimates from the 2024 Financial Report of the U.S., which values the present cost of these commitments, minus expected future taxes, at $175.3 trillion.
The data comes from government bodies such as the Social Security Administration and the Centers for Medicare and Medicaid Services, and spans what economists refer to as an infinite horizon.
These unfunded liabilities, though not listed on the immediate balance sheet, are legally binding obligations. Often referred to as off-balance-sheet debt, they represent real commitments that do not appear in the official national debt but still require eventual payment.
Balaji indirectly supported Elon Musk’s recent criticisms of Trump’s “Big Beautiful Bill”, which would extend the 2017 tax cuts, waive taxes on tips and overtime, and increase infrastructure spending.
Musk’s concerns, shared during Tesla’s earnings call in mid-June, prompted a sharp response from Trump, exposing growing friction between fiscal conservatives and political leadership.
The Congressional Budget Office estimates that this proposal could add another $3.8 trillion to the federal debt over the next decade.
Rather than being a short-term budget issue, the challenge reflects a deeper structural imbalance. It raises the question of whether the current system can realistically support the scale of its obligations.
As Srinivasan puts it, “There is no fix. It is a write-off. A national bankruptcy.” The default, he argues, will come through money printing, though doing so would impose a heavy cost on the U.S.
Worst H1 for the dollar in 50 years
If money printing is the only path forward, the market may already be responding. The U.S. dollar’s decline in 2025 has become one of the sharpest in modern history.
The U.S. Dollar Index fell 10.8% in the first half of the year, marking its worst first-half performance since the collapse of the Bretton Woods system in 1973. It also represents the weakest six-month stretch for the dollar since 2009.
The Bloomberg Dollar Spot Index has now recorded six consecutive monthly declines, equaling its longest losing streak in eight years.
Against major currencies, the dollar has dropped 14.4% against the Swiss franc, 13.4% against the euro, 10.5% against the Japanese yen, and 9.6% against the British pound.
Explanations for the slide often center on recent policy shifts. Tariffs introduced in January 2025 have disrupted trade flows, and the Federal Reserve has signaled a potential rate cut cycle to support a slowing economy.
Comments from the Fed’s Jun. 18 meeting minutes have added to near-term volatility while also revealing how these short-term policies interact with deeper structural imbalances that are harder to unwind.
Debt levels continue to weigh on the outlook. The U.S. national debt, which stood at 98.2% of GDP in 2020, is now projected to surpass 100% by the end of 2025, based on updated figures from the Kobeissi Letter.
The broader pressure is reflected globally. The IMF’s latest reserve data shows the dollar’s share of global foreign exchange reserves declined from 58.4% in 2023 to 57.4% by Q4 2024. In 2014, the share was close to 66%.
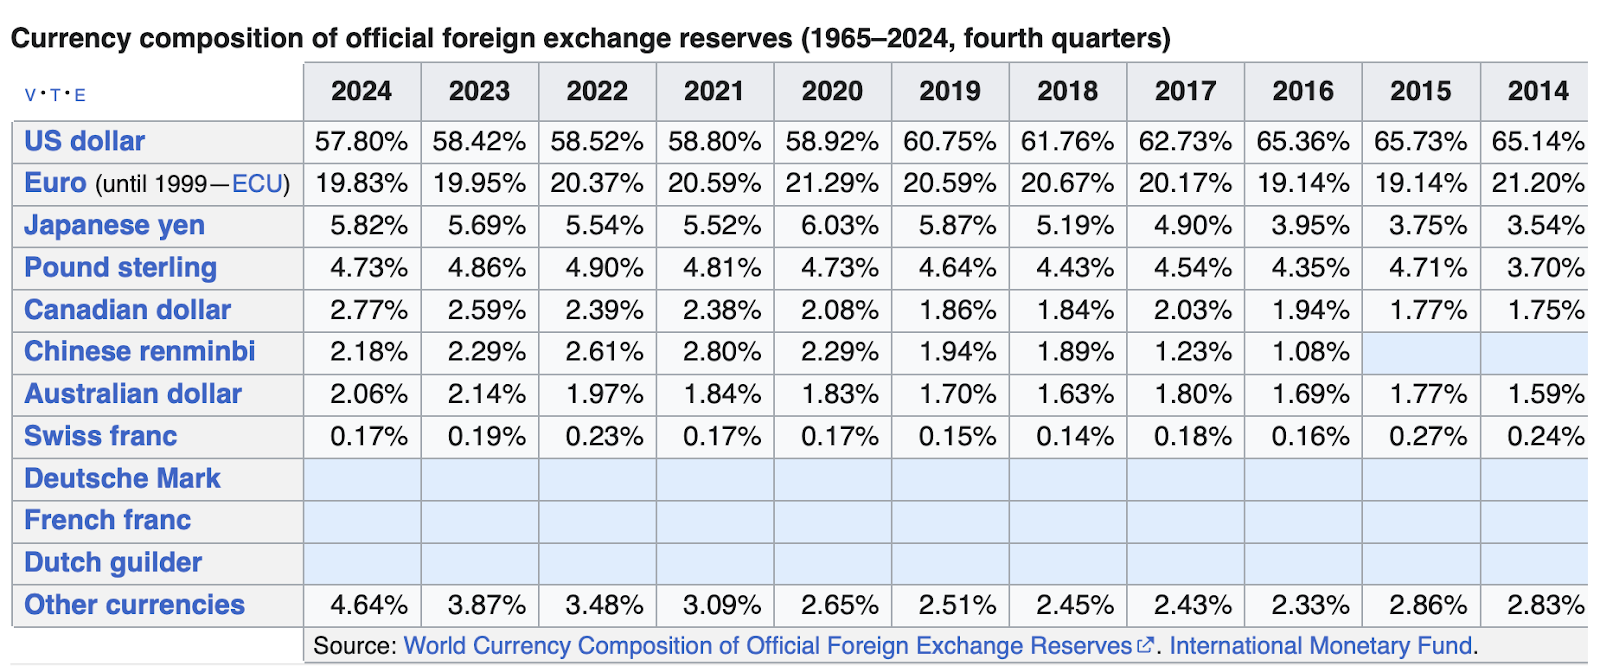
At the same time, central banks around the world have raised their holdings of gold and euros in Q2 2025.
Eroding confidence continues to expose the dollar to pressure from both market sentiment and underlying macroeconomic dynamics.
Print and inflate, or pay and stagnate
As the value of the dollar continues to decline and federal debt obligations expand, the structure of the economy is becoming more sensitive to external shocks and less responsive to policy interventions.
Inflation is likely to persist beneath the surface due to structural cost pressures. In 2024, the U.S. imported goods worth over $3.3 trillion, and the total trade deficit for goods and services reached a record $1.2 trillion.
A weaker dollar increases the cost of these imports, particularly in areas like energy, electronics, and industrial equipment.
Cost pressures from imports tend to pass through slowly across supply chains, creating persistent upward pressure on core inflation even when headline prices appear relatively stable.
On the fiscal side, interest payments are starting to take up a larger share of the federal budget. Net interest is projected to reach around $952 billion in 2025, which would amount to more than 18% of total federal revenue and nearly 3.2% of GDP — the highest level since the early 1990s.
Projections from the Congressional Budget Office suggest that interest costs could exceed $1 trillion annually by 2026.
Growing debt service requirements reduce the fiscal space available for other priorities such as infrastructure, healthcare, or longer-term investment.
Growth expectations are also softening. The Federal Reserve Bank of Philadelphia’s Q2 2025 survey anticipates real GDP growth at 1.4%, a downgrade from earlier forecasts.
At the same time, investment activity is losing momentum. Private domestic investment has been impacted by global supply disruptions and elevated borrowing costs, while tariff-related distortions have raised the price of imported components.
The Fed’s ability to maneuver is becoming more limited. Lowering rates to stimulate growth would weaken the dollar further and raise import prices.
Holding rates steady or tightening to defend the currency would drive up borrowing costs and potentially slow the economy even more.
Both directions carry trade-offs that are more binding than in previous cycles.
What emerges is a policy environment where inflation may remain sticky, economic growth may continue to ease, and the government’s financial flexibility may narrow further.
Without structural adjustments, the current path points toward an extended period of reduced policy effectiveness and intensifying systemic strain.
Bitcoin, gold, and hard-capped assets
Bitcoin (BTC), gold, and other hedges are gaining importance as structural alternatives in a system visibly under fiscal and monetary strain.
In less than a year since approval, spot Bitcoin ETFs in the U.S. have attracted over $135 billion in assets. The iShares Bitcoin Trust accounts for more than half of that total.
Participation is no longer limited to crypto-native firms. Capital is now coming from pension funds, family offices, and institutional allocators seeking exposure to a supply-capped, independent asset.
The total crypto market cap crossed $3.5 trillion in the second quarter of 2025. Bitcoin accounts for close to 60% of that value and reached a peak of $111,970 in May. Volatility has declined over the past three years, improving Bitcoin’s risk profile compared to earlier cycles.
Weaker correlations to equities and fixed income have made Bitcoin more attractive in multi-asset portfolios, especially during periods marked by rate uncertainty and dollar weakness.
Gold remains a key beneficiary of the current transition. Central banks purchased more than 1,000 tonnes in 2024 and are expected to add around 900 tonnes more in 2025.
A recent World Gold Council survey found that 76% of central banks plan to raise their gold allocations over the next five years.
Market forecasts continue to point to deeper integration of these assets into global portfolios. Long-term projections estimate that Bitcoin’s market cap could approach $5 trillion, representing a small but meaningful share of global wealth allocation.
Gold, while more established, continues to benefit from steady central bank demand and interest from investors looking to preserve purchasing power amid ongoing currency depreciation.
As debt levels rise and the dollar’s global role faces greater scrutiny, demand for these assets is likely to keep expanding unless there is a credible reversal in the fiscal and monetary policies that underpin current pressures.
You May Also Like

Egrag Crypto: XRP Could be Around $6 or $7 by Mid-November Based on this Analysis

‘High Risk’ Projects Dominate Crypto Press Releases, Report Finds
