

Pi Coin Sees Strong Inflows, But a Hidden Price Pattern Emerges
Pi Coin price has attempted a short-term recovery after recent weakness, showing modest upward movement. While buying interest has improved, the broader macro outlook remains cautious.
Structural indicators suggest the recent rise may be corrective, leaving the altcoin exposed to renewed downside pressure if momentum fades.
Pi Coin Investors Are Exhibiting Bullishness
Pi Coin is currently forming a hidden bearish divergence on the chart. Between December 19 and January 3, the price printed a lower high while the Relative Strength Index established a higher high. This divergence signals that upward price movement lacks strong underlying support.
Hidden bearish divergences typically appear during corrective rallies within downtrends. Despite short-term optimism, selling pressure remains dominant beneath the surface.
This setup suggests the primary bearish trend may resume once temporary buying interest weakens, increasing downside risk for Pi Coin.
Want more token insights like this? Sign up for Editor Harsh Notariya’s Daily Crypto Newsletter here.
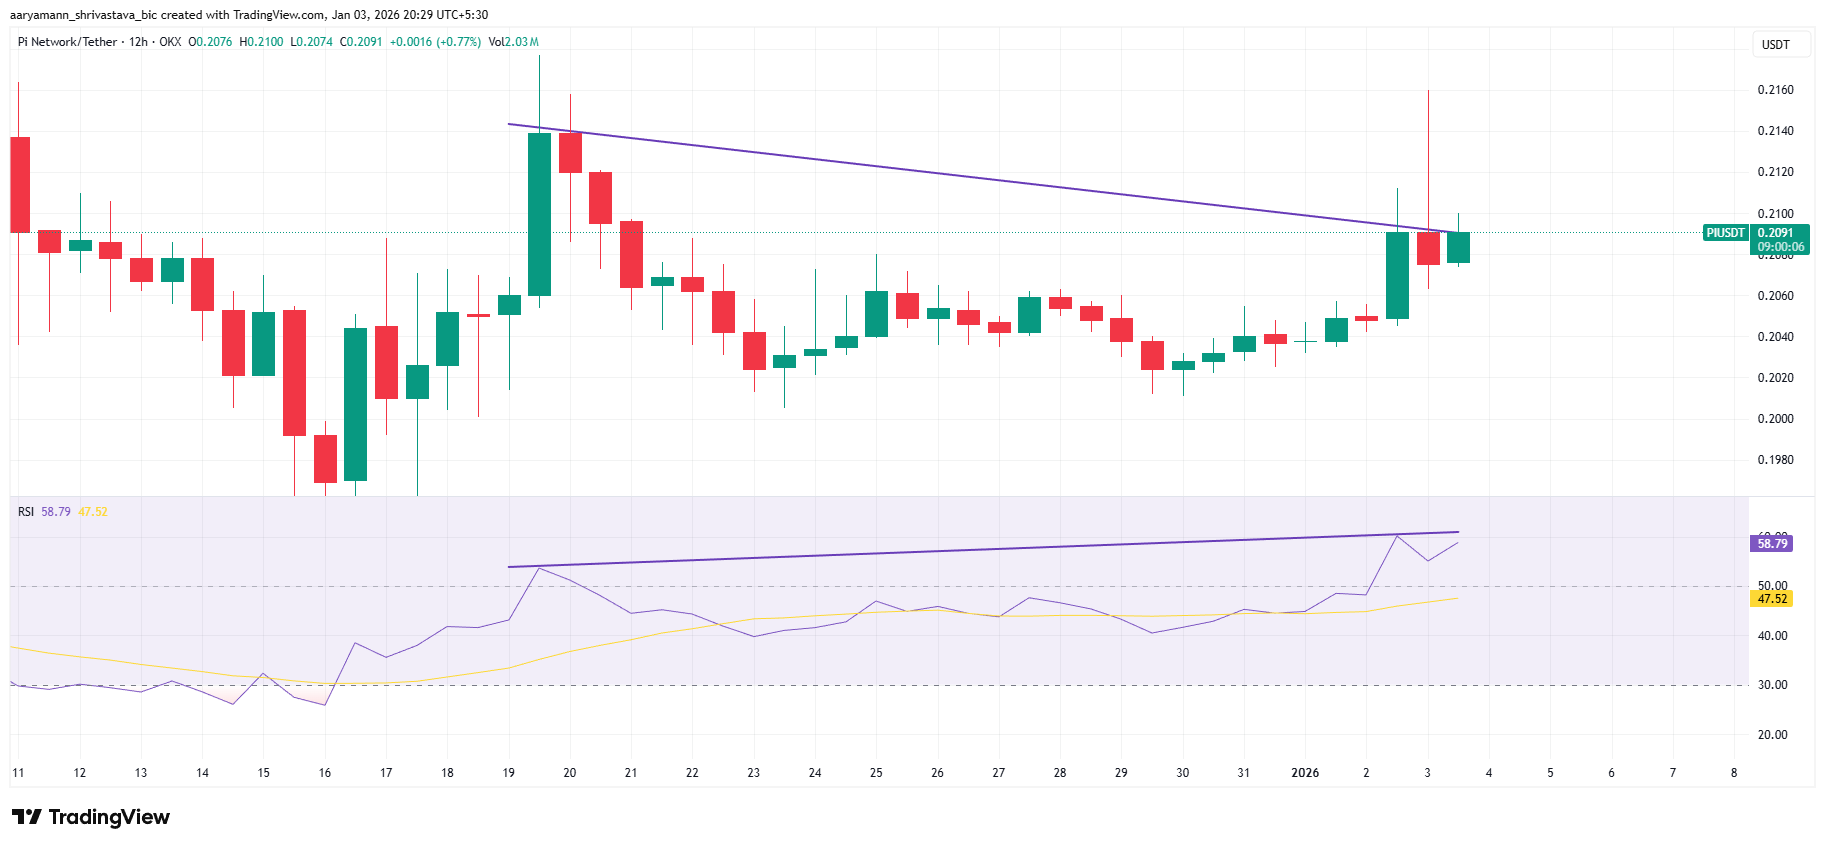 Pi Coin RSI Divergence. Source: TradingView
Macro indicators present a more balanced picture. The Chaikin Money Flow has climbed above the zero line, reaching a near-monthly high. CMF tracks volume-weighted capital flows, making it a reliable gauge of investor commitment during uncertain conditions.
A rising CMF indicates sustained accumulation rather than speculative spikes. Investors appear willing to deploy capital despite mixed technical signals. This accumulation has supported recent price stability and limited deeper losses, providing Pi Coin with a short-term cushion against broader market volatility.
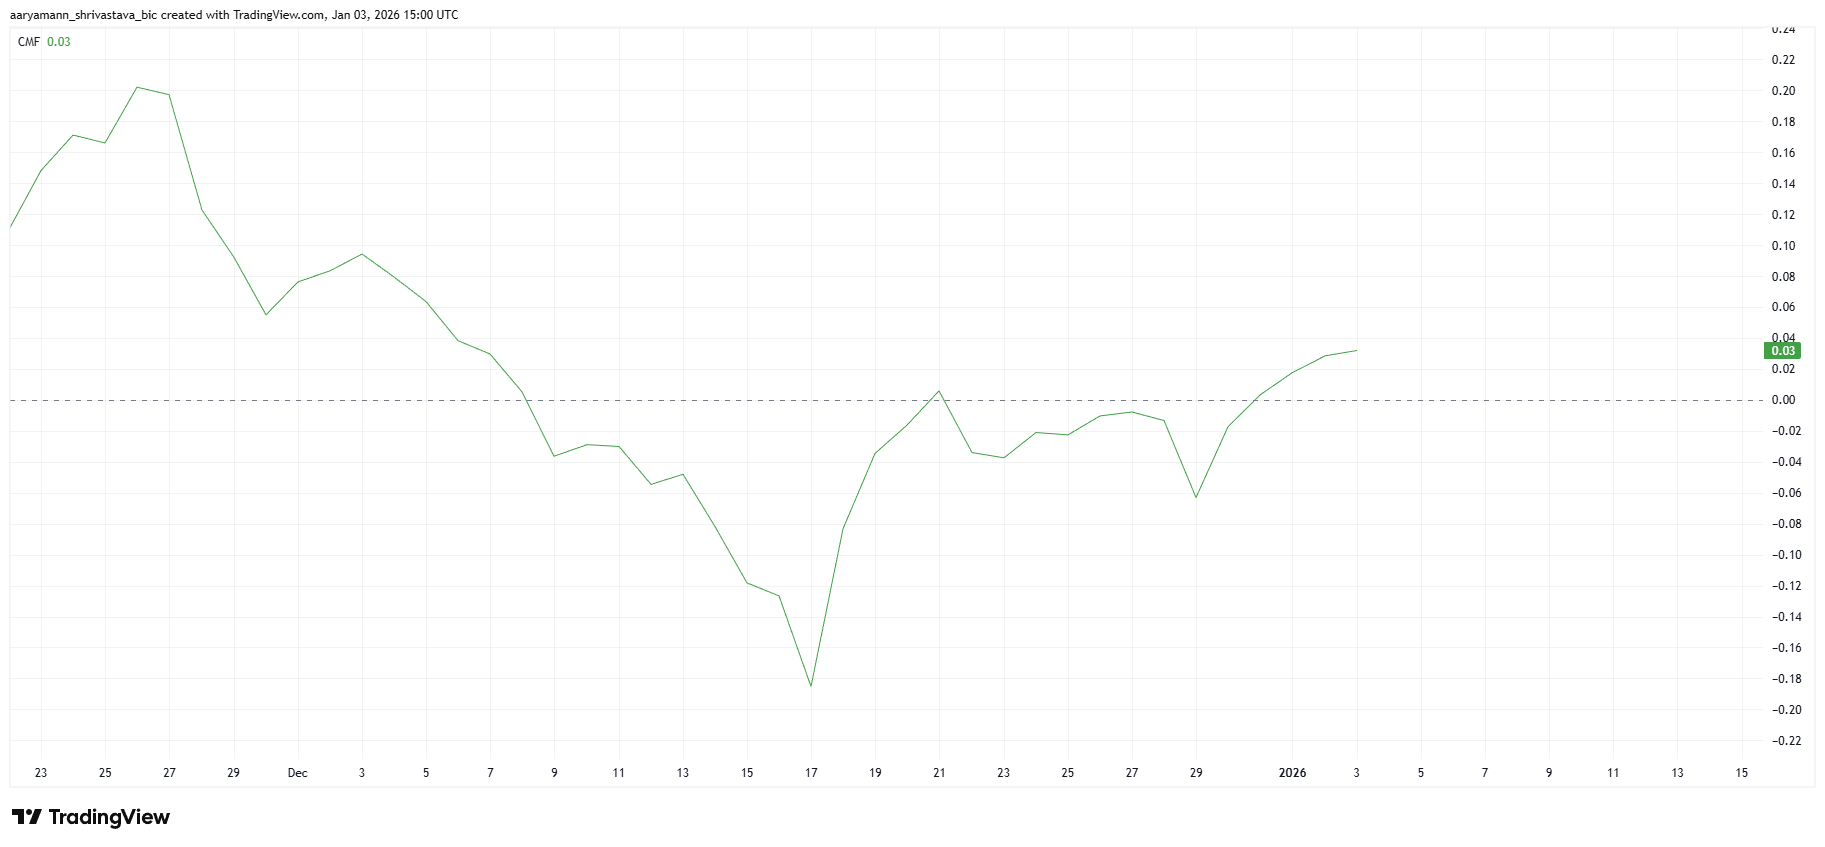 Pi Coin CMF. Source: TradingView
PI Price Faces Barrier
Pi Coin’s immediate challenge remains the $0.214 resistance. This level aligns closely with the 23.6% Fibonacci retracement, strengthening its significance. Multiple rejections near this zone highlight persistent selling pressure from traders defending higher cost basis levels.
Escaping bearish momentum requires a decisive shift. A sustained close above $0.214 would confirm a trendline breakout. Such a move could open upside toward $0.226, with additional gains possible if volume expands and broader sentiment improves.
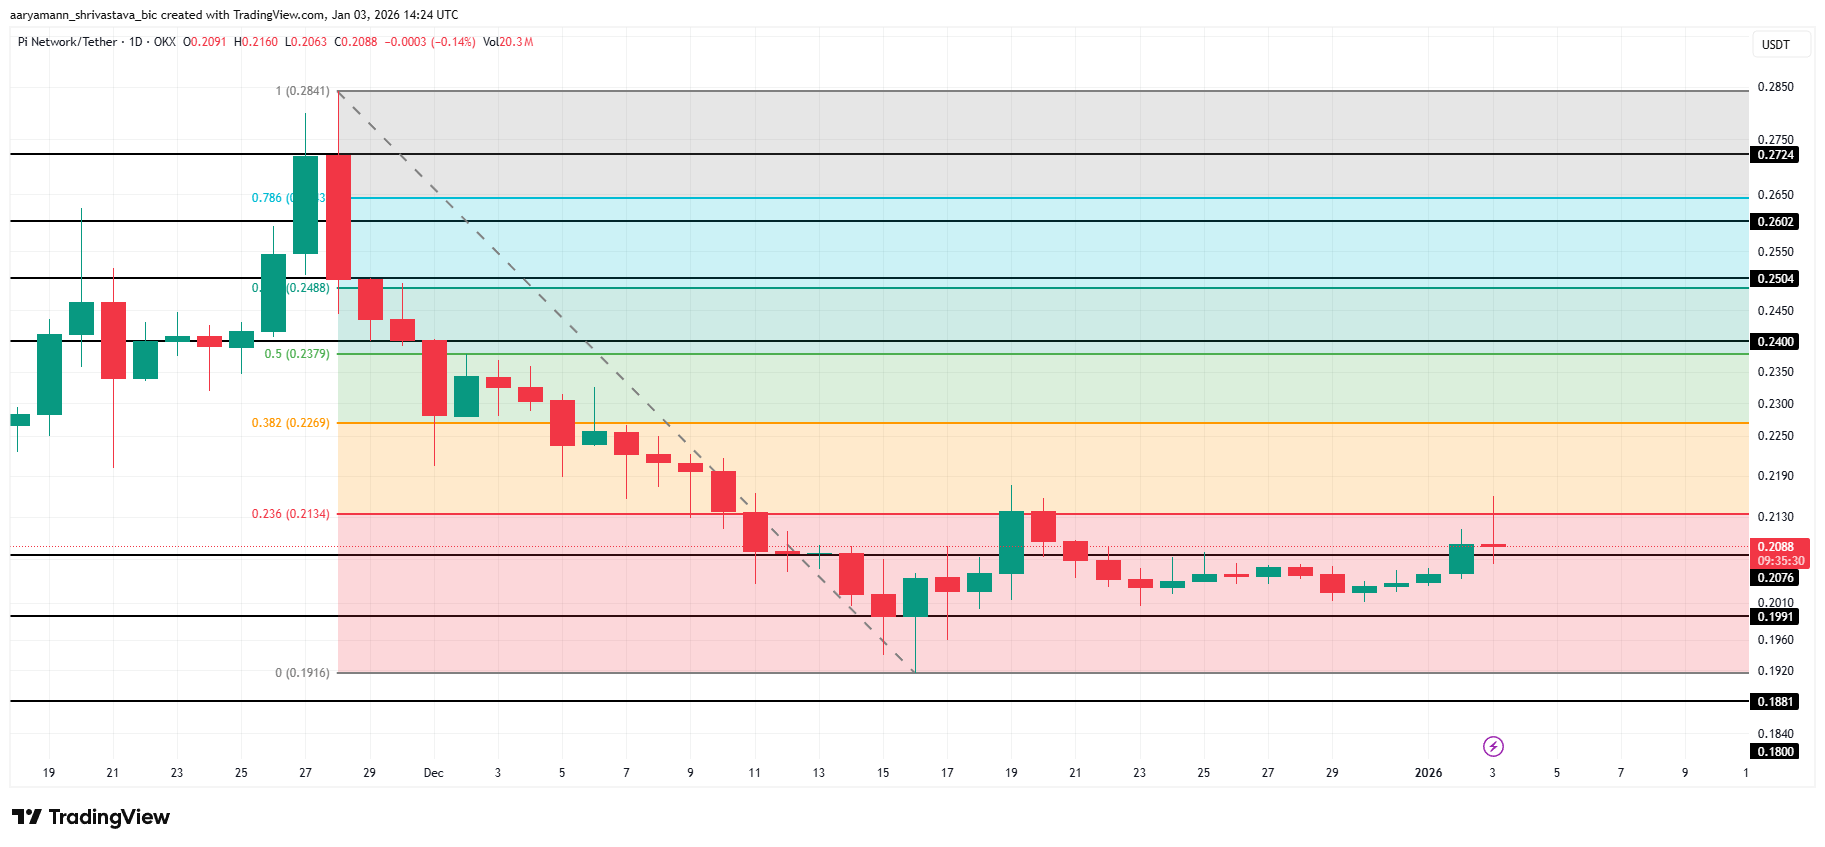 Pi Coin Price Analysis. Source: TradingView
Failure to maintain bullish momentum would expose Pi Coin to renewed declines. A drop below $0.207 may trigger accelerated selling. In that scenario, price could test the critical $0.199 support, reinforcing the prevailing bearish outlook if buyers fail to defend the level.
You May Also Like

Low Oil Prices Could Trigger a Bitcoin Bull Run

Unleashing A New Era Of Seller Empowerment

Don’t hold your breath for Venezuela’s bitcoin
Copy linkX (Twitter)LinkedInFacebookEmail