The crypto market’s bearish tone is strengthening day-by-day, instead of reversing it. Most of the notable tokens are trading on the downside, in the red. The largestThe crypto market’s bearish tone is strengthening day-by-day, instead of reversing it. Most of the notable tokens are trading on the downside, in the red. The largest

BNB Under Pressure: With Volume Up 63%, Will Bulls Reload or Bears Take Firmer Control?

2026/01/26 21:14
3 min read
  • BNB trades at around $872.
  • Trading volume is up by over 63%.

The crypto market’s bearish tone is strengthening day-by-day, instead of reversing it. Most of the notable tokens are trading on the downside, in the red. The largest assets, like Bitcoin (BTC) and Ethereum (ETH), are hovering at $87.7K and $2.8K, respectively. Meanwhile, the BNB price has made a brief 0.71% slip in value. 

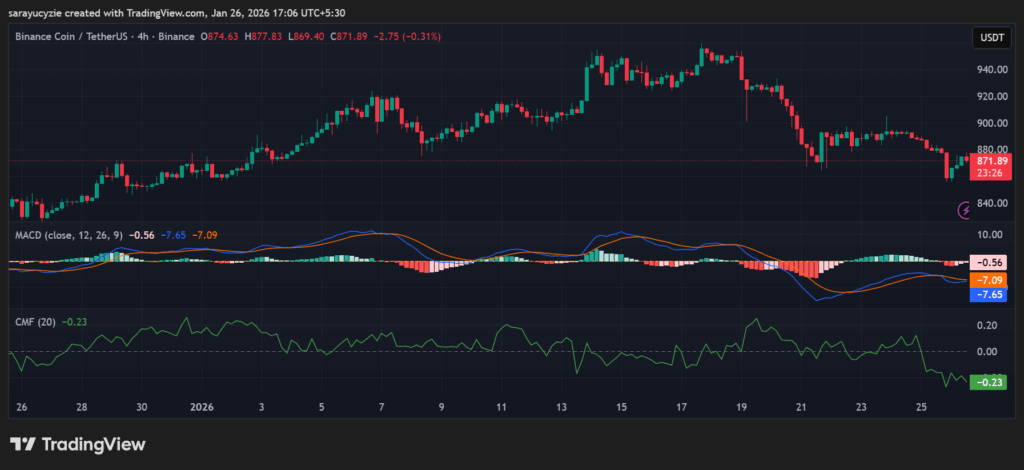
In the morning hours, the asset traded at a high range of $879.88. With the bearish shift in the BNB market, the price has fallen to the downside, trading at $855.91. Currently, BNB is trading at around $872.82, with its trading volume up by over 63.48% to $2.3 billion. The BNB market has observed $3.06 million liquidated in the last 24 hours. 

With the bearish outlook, the BNB price could fall to the $868.52 support. If the bearish correction gains more power, the death cross takes place, and the bears might send the price below $864.31. Assuming the asset’s chart turns green, the price might rise toward the $876.45 resistance. Upon the bullish pressure strengthening, it triggers the formation of the golden cross, and drives the BNB price to $880.11.

Technical Indicators Show Bears Taking Control of BNB

Zooming in on the technical chart of BNB, the Moving Average Convergence Divergence (MACD) signal lines are below the zero line, displaying bearish momentum. Near-term price action is underperforming relative to the longer-term trend. Unless the lines start moving back to zero, the downside pressure will remain. 

BNB chart (Source: TradingView)

Moreover, the Chaikin Money Flow (CMF) indicator of -0.23 reflects a strong selling pressure in the BNB market. More capital is flowing out of the asset than into it, and distribution is happening rather than accumulation. Notably, if the value rises negatively, it reinforces the bearish bias.

The daily Relative Strength Index (RSI) found at 39.94 suggests weak momentum, leaning to the bearish side. As BNB is below the neutral level, the sellers have the upper hand but have not yet oversold. Also, there is still room for more downside unless buying pressure pops up and pushes it back above 45-50.

BNB’s Bull Bear Power (BBP) reading of -6.13 indicates strong bearish dominance, with the bears pushing the price below. This implies heavy downside pressure, and unless it starts moving back toward the zero line, the current trend is likely to remain weak or bearish.

Top Updated Crypto News

Ethereum (ETH) Treads Water Below $3K: Will Bulls or Bears Take Control?

Disclaimer: The articles reposted on this site are sourced from public platforms and are provided for informational purposes only. They do not necessarily reflect the views of MEXC. All rights remain with the original authors. If you believe any content infringes on third-party rights, please contact [email protected] for removal. MEXC makes no guarantees regarding the accuracy, completeness, or timeliness of the content and is not responsible for any actions taken based on the information provided. The content does not constitute financial, legal, or other professional advice, nor should it be considered a recommendation or endorsement by MEXC.

You May Also Like

Bitcoin Whales Sell 147,000 BTC Since August, Fastest Selloff Of Cycle

Bitcoin Whales Sell 147,000 BTC Since August, Fastest Selloff Of Cycle

On-chain data shows the Bitcoin whales are selling at their fastest monthly rate of the cycle, a potential reason behind the asset’s latest decline. Bitcoin Whale Holdings Have Significantly Dropped Over The Past Month In a new post on X, CryptoQuant Head of Research Julio Moreno has listed a contributing factor behind the recent plunge in the Bitcoin price. The factor in question is the trend in the holdings of the whales. Whales are defined as BTC investors carrying more than 1,000 tokens of the cryptocurrency in their wallet balance. At the current exchange rate, this cutoff converts to about $112.8 million. Thus, the only holders qualifying for the group would be those with a substantial amount of capital. Related Reading: Bitcoin Dip-Buy Calls Spike: Why This Could Actually Be Bearish Exchanges and mining pool wallets may technically fulfill this requirement, but they are excluded from the group because they aren’t considered “normal” network participants. Given that the whales include some of the most influential investors in the market, their behavior can be something to keep an eye on, as it may sometimes have a direct impact on the asset’s trajectory. Even when it doesn’t, it can still be revealing about the sentiment among these humongous holders. One way to gauge whale behavior is through their total supply. Below is the chart shared by Moreno that shows how this metric has changed over the past year. As displayed in the graph, the Bitcoin whale supply saw a huge drawdown last month, indicating that the large holders participated in some significant net distribution. The metric made some slight recovery as BTC’s spot price surged above $117,000, but the trend has quickly flipped during the last few days as the indicator has registered another sharp plunge. Related Reading: Here’s The Boundary Bitcoin Bulls Must Defend To Save Rally Since August 21st, whales have sold a net total of 147,000 BTC, worth a whopping $16.6 billion. This selloff has taken the 30-day change in the cohort’s supply to the largest negative value of the cycle so far. Considering the timing of the selling, it’s possible that this is one of the reasons why Bitcoin has faced bearish price action recently. The market selloff may not be over yet, either, if the trend in the Exchange Inflow is anything to go by. As the CryptoQuant head has pointed out in another X post, the Bitcoin Exchange Inflow witnessed a surge on Tuesday. Investors generally deposit their coins in centralized exchanges when they want to participate in one of the services that they provide, which can include selling. As such, the growth in the Exchange Inflow could be a sign that holders are still trading away their Bitcoin. BTC Price Bitcoin slipped under $112,000 on Tuesday, but the coin has seen a slight bounce since then as its price has climbed to $113,000. Featured image from Dall-E, CryptoQuant.com, chart from TradingView.com
Share
NewsBTC2025/09/25 02:00
Travelzoo Q4 2025 Earnings Conference Call on February 19 at 11:00 AM ET

Travelzoo Q4 2025 Earnings Conference Call on February 19 at 11:00 AM ET

NEW YORK, Feb. 9, 2026 /PRNewswire/ — Travelzoo® (NASDAQ: TZOO): WHAT: Travelzoo, the club for travel enthusiasts, will host a conference call to discuss the Company
Share
AI Journal2026/02/10 01:46
TradFi vs. Crypto: Bybit Launches 300,000 USDT Trading Challenge as Copy Trading Gains Momentum in Volatility

TradFi vs. Crypto: Bybit Launches 300,000 USDT Trading Challenge as Copy Trading Gains Momentum in Volatility

DUBAI, UAE, Feb. 9, 2026 /PRNewswire/ — Bybit, the world’s second-largest cryptocurrency exchange by trading volume, is calling traders across the TradFi and crypto
Share
AI Journal2026/02/10 01:45