Bitcoin is attempting to recover from recent lows, but technical indicators and higher-timeframe structure suggest the broader trend remains bearish unless key Bitcoin is attempting to recover from recent lows, but technical indicators and higher-timeframe structure suggest the broader trend remains bearish unless key

Bitcoin Technical Outlook: Key Levels, Resistance Zones, and Why $72,500 Matters

2026/02/10 15:23
3 min read
Bitcoin Technical Outlook: Key Levels, Resistance Zones, and Why $72,500 Matters

Bitcoin has entered a recovery phase after bouncing from its $60,500 trough, but technical indicators continue to show a market struggling to regain bullish control.

The price has stabilized near the $70,000 level after reclaiming the $68,800 resistance zone. Bitcoin is currently trading above the 100-hour simple moving average, a short-term bullish signal, though upside momentum remains limited.

Trend Structure Remains Bearish

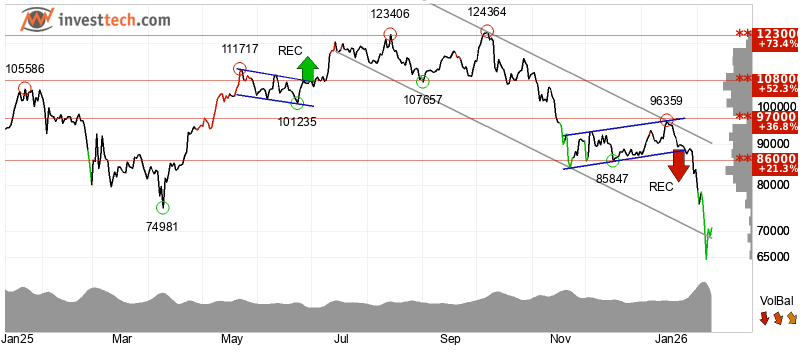
Despite recent gains, the broader technical structure remains bearish. Bitcoin continues to trade within a falling trend channel on the medium- to long-term timeframe. According to InvestTech, falling trend channels typically reflect weakening buying interest and negative price development.

The overall trend will remain bearish until Bitcoin can reclaim the 200-day exponential moving average, currently located near $95,700.

Key Resistance Levels

Bitcoin Technical Outlook: Key Levels, Resistance Zones, and Why $72,500 MattersSource: InvestTech

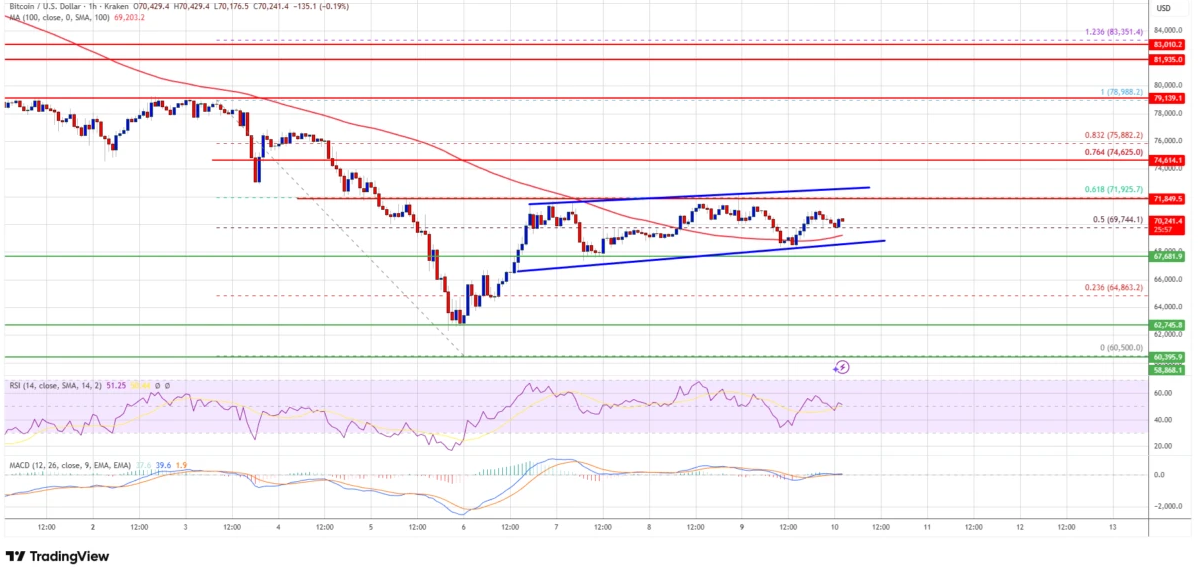
Bitcoin is facing significant resistance in the $72,000–$72,500 zone. This area coincides with the 61.8% Fibonacci retracement of the decline from the $78,988 high to the $60,500 low.

A confirmed breakout above $72,500 could open the door to further upside, with potential resistance levels at:

  • $74,650
  • $75,880
  • $76,500
  • $77,200

However, sellers remain active in this range, repeatedly rejecting attempts to push prices higher.

Support Levels to Watch

On the downside, immediate support lies at $69,400, followed by stronger levels at:

  • $68,500
  • $67,600
  • $66,500

The $65,000 level remains the principal support zone. A sustained move below this level would significantly weaken the short-term outlook and make a recovery more difficult.

Indicators and Momentum

On the daily chart, the Relative Strength Index (RSI) is rebounding from deeply oversold conditions and currently sits near 32.5, suggesting that selling pressure may be easing. Meanwhile, the MACD remains in bearish territory, although the narrowing gap between signal lines indicates that downward momentum is losing strength.

On shorter timeframes, the hourly RSI has moved above 50, while the hourly MACD shows waning bearish momentum. A rising channel has formed on the hourly BTC/USD chart, with support near $68,800.

Bitcoin Technical Outlook: Key Levels, Resistance Zones, and Why $72,500 Matters

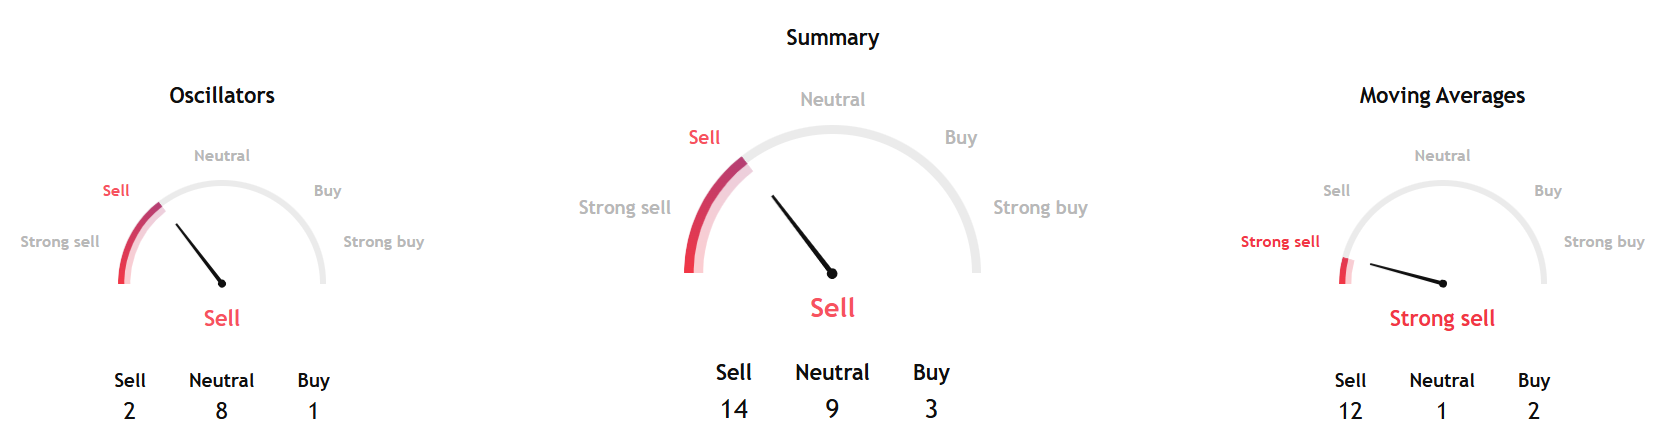
TradingView’s weekly technical summary continues to flash a sell signal across moving averages, oscillators, and pivot levels.

Bitcoin Technical Outlook: Key Levels, Resistance Zones, and Why $72,500 MattersSource: TradingView

Scenario Outlook

If Bitcoin can hold above $68,800 and successfully break through the $72,500 resistance zone, a short-term move toward $74,750 — and potentially higher — remains possible.

Failure to clear resistance, however, could trigger another leg lower, with price potentially revisiting the $65,000–$60,000 support range.

For now, technicals suggest that while downside momentum is weakening, the broader trend remains bearish until proven otherwise.

Separately, InvestTech's Algorithmic Overall Analysis and recommendation for one to six weeks gives a negative score.

The research firm said, "Bitcoin is in a falling trend channel in the medium-long term. Falling trends indicate that the currency experiences negative development and falling buying interest among investors. There is no support in the price chart, and further decline is indicated. In case of a positive reaction, the token has resistance at $86,000."

➢ Stay ahead of the curve. Join Blockhead on Telegram today for all the latest in crypto.
+ Follow Blockhead on Google News
Disclaimer: The articles reposted on this site are sourced from public platforms and are provided for informational purposes only. They do not necessarily reflect the views of MEXC. All rights remain with the original authors. If you believe any content infringes on third-party rights, please contact [email protected] for removal. MEXC makes no guarantees regarding the accuracy, completeness, or timeliness of the content and is not responsible for any actions taken based on the information provided. The content does not constitute financial, legal, or other professional advice, nor should it be considered a recommendation or endorsement by MEXC.

You May Also Like

Vàng Cán Mốc Lịch Sử 5.000 USD: Khi Dự Báo Của CEO Bitget Gracy Chen Trở Thành Hiện Thực Và Tầm Nhìn Về Đích Đến 5.400 USD

Vàng Cán Mốc Lịch Sử 5.000 USD: Khi Dự Báo Của CEO Bitget Gracy Chen Trở Thành Hiện Thực Và Tầm Nhìn Về Đích Đến 5.400 USD

Thị trường tài chính toàn cầu vừa chứng kiến một khoảnh khắc lịch sử chấn động: Giá Vàng thế giới [...] The post Vàng Cán Mốc Lịch Sử 5.000 USD: Khi Dự Báo Của
Share
Vneconomics2026/02/10 16:26
Why the Bitcoin Boom Is Not Another Tulip Mania

Why the Bitcoin Boom Is Not Another Tulip Mania

Bitcoin is an amazing success story. It was only invented in January of 2009 and was only worth a tiny fraction of a cent for each token. Over just a few years
Share
Medium2026/02/10 15:44
Cracker Barrel Must Inspire More Confidence After Rebrand Fail

Cracker Barrel Must Inspire More Confidence After Rebrand Fail

The post Cracker Barrel Must Inspire More Confidence After Rebrand Fail appeared on BitcoinEthereumNews.com. HOMESTEAD, FLORIDA – AUGUST 21: A Cracker Barrel sign featuring the old logo is seen outside of a restaurant on August 21, 2025 in Homestead, Florida. The restaurant unveiled a new logo earlier this week as part of a larger brand refresh. The new logo removes the image of a man sitting next to a barrel and the phrase “old country store”. Now the logo will feature the words “Cracker Barrel” against a yellow background. (Photo by Joe Raedle/Getty Images) Getty Images Cracker Barrel should have left well enough alone. In the first earnings call after its catastrophic rebrand, which triggered an immediate customer backlash and forced a sheepish reversal, the company reported a 5.4% increase in comparable store restaurant sales and a 4.4% revenue gain in fourth quarter 2025, adjusting for the 53rd week in 2024. In more positive news, it ended the year up 2.2%, hitting the high end of guidance at $3.5 billion and bettered its adjusted EBITDA target at $224.3 million, up 9%, adjusting for the extra week. The problem is that these positive results came before, not after it shocked customers with the rebrand news. Cracker Barrel’s fiscal year ended August 1. The “All the More” rebrand featuring a new logo and plans to remodel its chain of 660 stores was announced on August 19. In a week, it reversed course on the logo change, then on September 9, it cancelled plans for the remodel. Self-Inflicted Damage Now it is left to pick up the pieces. Foot traffic declined 8% after the mid-August announcement and management is expecting year-end foot traffic to be off between -4% and -7%, assuming sequential quarterly improvements after investing an additional $16 million in advertising and marketing. It’s guiding on total revenue in the $3.35 billion to $3.45 billion range…
Share
BitcoinEthereumNews2025/09/19 06:47