Solana Price Prediction: Will SOL Reclaim $90 or Drop to $70?
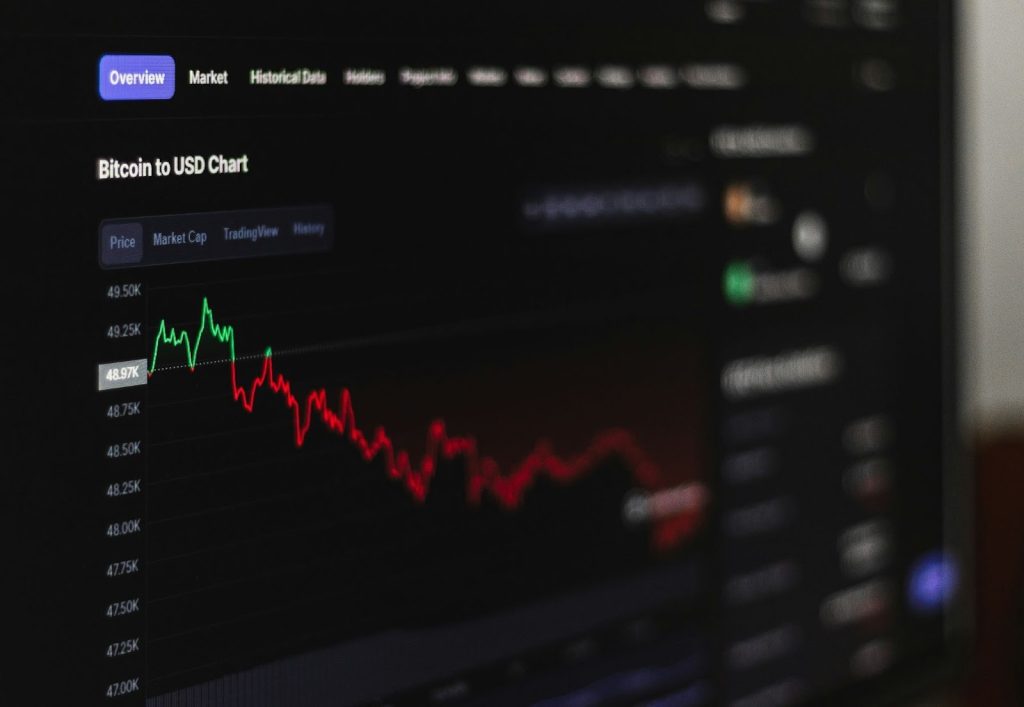
Solana holds near a critical inflection point as analysts debate whether the recent pullback marks a temporary pause or a deeper reset. The token trades around $85 after a modest daily gain, yet the broader structure remains under scrutiny.
Wave (2) Pullback Tests Key Fibonacci Levels
According to moretradingonl, the broader structure remains intact despite choppy micro price action. The analyst still classifies the decline as wave (2). Significantly, price reacted firmly near the 50% retracement around $83.60. That level now acts as immediate support.
Additionally, the 61.8% retracement near $81.88 and the 78.6% level around $79.50 provide deeper cushions if volatility expands. Bulls must now clear the 38.2% retracement at $85.35.
Consequently, reclaiming the prior wave (1) high between $89 and $90 would confirm renewed strength. A decisive move above that zone could open the path toward $97 and possibly $100.89. However, failure to hold $83 would likely extend consolidation.
Macro Structure Remains Below $120 Ceiling
Crypto_Scient maintains a cautious macro stance. The weekly chart shows Solana trading below the former $120 support, which now acts as resistance. Hence, rallies remain corrective until that ceiling breaks.
The analyst identifies two major downside zones. First, the 0.75 Fibonacci pocket between $60 and $70 aligns with prior accumulation. Moreover, that range overlaps with historical demand.
Second, the weekly demand imbalance that fueled the rally from $25 to $200 stands as a deeper support base. Everything between these zones appears transitional noise.
Additionally, the market cap remains above $48 billion, supported by steady network participation. However, macro pressure persists while price trades under $120.
Long-Term Conviction Versus Short-Term Pressure
James takes a broader perspective. He argues that if Solana eventually approaches $1000, current prices below $90 may look like strategic accumulation. Nevertheless, the weekly chart shows clear resistance at $90, $105, and $120.
Source: X
Consequently, bulls must defend the $67–$70 region to preserve higher-timeframe structure. A clean bounce there could form a durable base. Besides, a recovery above $100 would improve sentiment and attract sidelined capital.
You May Also Like

We should be prepared for “short-term disruptions” in the labor market from AI

Gold continues to hit new highs. How to invest in gold in the crypto market?