

Bitcoin (BTC) Price: Weekly Decline Follows Historical September Pattern
TLDR
- Bitcoin price dropped from $112,600 to $109,329, facing resistance at the $112,000 level
- US jobs report on Friday could impact Fed’s decision on interest rates
- Despite market uncertainty, data shows retail and institutional traders buying BTC
- Bitcoin historically performs worst in September, averaging -3.77% returns since 2013
- “Uptober” rally typically follows September weakness, with Bitcoin gaining in October six years in a row
Bitcoin has experienced a rollercoaster ride this week as the cryptocurrency market reacts to economic data and awaits the crucial US jobs report. The leading digital asset reached $112,600 on Wednesday before sellers stepped in during the Asian trading session, pushing the price down to $109,329 on Thursday.
The downward pressure coincided with weak ADP private hiring data that showed an increase of just 54,000 jobs in August, falling short of the expected 75,000.
Market participants are now focused on Friday’s US jobs report, which will provide more comprehensive insights into the labor market’s health.
Recent data revealed that the US now has more unemployed people (7.24 million) than those with jobs (7.18 million), raising concerns about economic stability.
Economists hope August data will show 80,000 jobs added, though some fear the figure might fall well below expectations.
For Bitcoin traders, signs of a slowing labor market could be positive as they indicate the Federal Reserve may cut interest rates.
The CME Group’s FedWatch tool currently shows a 97.6% probability that the Fed will lower the benchmark rate by 25 basis points at its September meeting.
Many traders believe such a move could trigger a turnaround in Bitcoin’s price trajectory.
September Effect on Bitcoin
Bitcoin has historically struggled during September. Since 2013, it has closed lower in 8 out of 12 Septembers, with an average return of approximately -3.77% for the month.
This seasonal dip mirrors trends in traditional equity markets, where the S&P 500 averages about -1.2% returns in September.
The current sell-off began after Bitcoin topped $124,000 on August 13, with the price falling about 13% by the end of the month.
From 2013 to 2016, Bitcoin’s September performance was balanced, posting gains in two years and losses in two.
However, the trend shifted in 2017 amid the surge of the initial coin offering boom. On September 4 that year, China’s central bank banned ICOs, triggering the first of six straight losing Septembers.
Market Outlook and Institutional Factors
Despite the market uncertainty, data from Hyblock shows that both retail and institutional-sized traders are buying Bitcoin in the spot markets.
The BTC/USDT liquidation heatmap indicates the price is tightly bound between $109,000 and $111,200, with profit-taking by short-term traders near the range highs.
The bearish September streak finally ended with Bitcoin posting gains in September 2023 and 2024, including a record 7.29% jump last September.
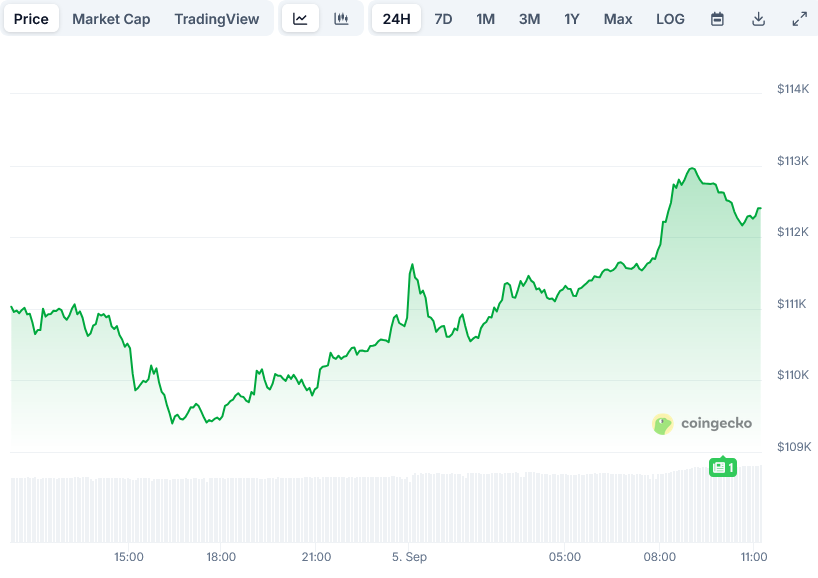 Bitcoin Price on CoinGecko
Institutional catalysts helped change the pattern. The introduction of US spot Bitcoin ETFs in January 2024 opened a new institutional demand channel that supported the late-year rally.
Investors are now focused on the Fed’s September 16-17, 2025 meeting. Fed Governor Christopher Waller has expressed support for a 25-basis-point cut in September and expects further cuts over the next 3-6 months.
Chair Jerome Powell’s speech at Jackson Hole also struck a dovish tone, warning that a “shifting balance of risks” might warrant easing policy.
If a rate cut comes in mid-September, it would extend last year’s dovish turn when the Fed cut rates by 50 basis points on September 18, 2024.
New capital flows may help offset September’s seasonal weakness. US spot Bitcoin ETFs have quickly amassed large portfolios since their launch in January 2024 and continue to post billions in daily turnover.
Some public companies have even added Bitcoin to their treasuries in 2025, providing extra support through late summer.
History suggests any late-September dip often reverses in October. Data confirms Bitcoin gained in October six years in a row and has seen only two losing Octobers on record.
October now ranks as Bitcoin’s second-strongest month after November. The so-called “Uptober” rally has frequently recovered September’s losses in past cycles.
The post Bitcoin (BTC) Price: Weekly Decline Follows Historical September Pattern appeared first on Blockonomi.
You May Also Like

nLIGHT to Announce Fourth Quarter and Full Year 2025 Financial Results on February 26th
When silver became a meme stock, retail investors ultimately caught the falling knife.
