

Shiba Inu Price Shows Short-Term Strength: SHIB Could Rally 50% If This Happens

Shiba Inu has been quietly building something that caught the interest of traders. After months of grinding lower within a descending channel, Shiba Inu finally showed signs of life. WorldOfCharts shared the setup on X, noting that SHIB has given a clean breakout from the counter trendline, showing signs of short-term strength.
He believes that SHIB is moving towards the upper descending trendline, which is the next significant level of resistance. If SHIB is able to break through this line as well, a significant rally of 50% or more may be in store. For now, the target is the upper trendline.
The SHIB Daily Chart Reveals the Setup
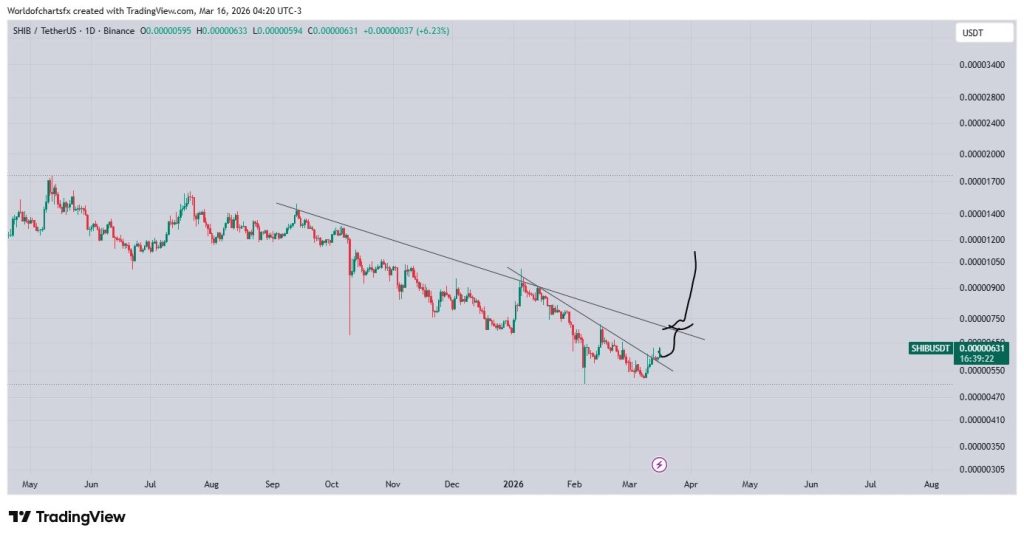
Looking at the daily chart shared by WorldOfCharts, the structure becomes clear. The SHIB price has been trading within a well-defined descending channel since the highs of 2024.
Each rally attempt made a lower high, and each pullback made a lower low, creating the classic pattern of a downtrend. The upper boundary of this channel has acted as resistance for over a year, rejecting every attempt to break higher.
 Source: X/@WorldOfCharts1
The current SHIB price sits near $0.00000631, up 6.23% on the session. The recent move broke above a shorter-term counter trendline that had been capping price action since the February lows. This breakout represents the first sign that selling pressure may be exhausting and buyers are beginning to step in.
The chart illustrates the decline of SHIB from the highest point at $0.000034 to the current lowest point at $0.00000305. It is easy to notice the descending channel where the price keeps bouncing between the support and resistance lines as it moves lower.
With the prices now breaking above the counter-trend line, there may be a change in momentum, but the larger obstacle remains the resistance in the main channel.
The Next Target: Upper Descending Trendline
The next major challenge is the upper descending trend line, which has been defining the channel since 2024. This trend line represents the next major level of resistance that SHIB needs to overcome. WorldOfCharts identifies this as the primary target for the current move.
If the SHIB price can break above this upper trendline, the technical picture changes dramatically. Such a move would represent a’’ breakout from the multi-year descending channel that has trapped price action since the peak. The analyst notes that a successful break could trigger a 50% plus rally, targeting the next resistance zones above.
The measured move from such a breakout would project toward the $0.000009 to $0.00001050 zone initially, with higher levels coming into play if momentum builds. This aligns with previous support-turned-resistance levels visible on the chart.
Read Also: Virtuals Protocol (VIRTUAL) Shows AI Agents Can Thrive Off Ethereum – Here’s What That Means
What Comes Next for the SHIB Price
The SHIB price now sits at a critical juncture. The counter trendline breakout provides the first sign of strength in months. The next test comes at the upper channel resistance. If the price can overcome this level, it would be a sign of a larger trend change and open the way for a strong rally.
On the downside, SHIB must remain above the breached counter-trend line to maintain the positive setup. A move below would mean the breakout was a false signal and the bearish trend is still on track. The level of support below is found at the recent lows of $0.00000550 and the low of February at $0.00000470.
WorldOfCharts has identified the levels that matter. The counter trendline breakout is the first step. The upper channel resistance is the next hurdle. If the SHIB price clears both, a 50% rally becomes a realistic target. For now, traders watch to see whether this strength continues or fades at resistance as it has so many times before.
Subscribe to our YouTube channel for daily crypto updates, market insights, and expert analysis.
The post Shiba Inu Price Shows Short-Term Strength: SHIB Could Rally 50% If This Happens appeared first on CaptainAltcoin.
You May Also Like
PENDLE at $1: Can Bulls Clear the Next Key Barrier?

Pepe Coin Price Prediction: Ethereum Treasury Companies Suffer Unrealized Losses as Pepeto’s Three Infrastructure Products Cross $7.99 Million Presale
