Middle East escalation is taking a back seat in the markets as traders await Fed's decision.Middle East escalation is taking a back seat in the markets as traders await Fed's decision.

Dow Jones up 100 points as Fed takes focus away from Israel-Iran war

2025/06/19 00:59

Stock markets are zeroing in on the Federal Reserve’s key interest rate decision, while the conflict in the Middle East takes a step out of the spotlight.

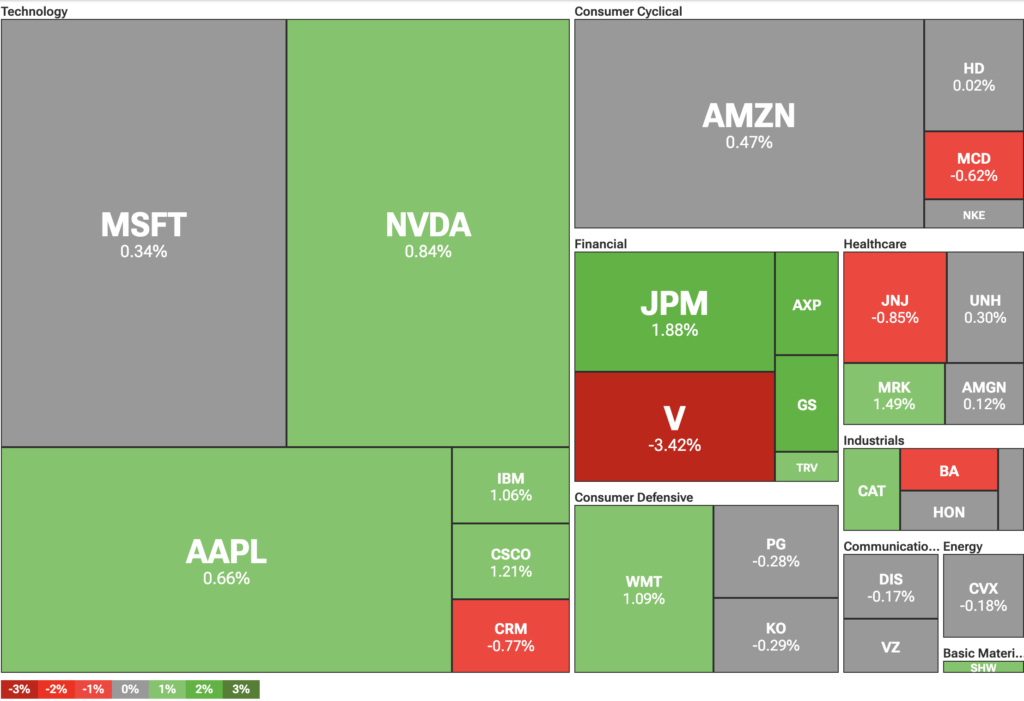
Major U.S. stock indices were higher ahead of the announcement. On Wednesday, June 18, the Dow Jones rose 132 points, or 0.31%. At the same time, the S&P 500 gained 0.40%, while the NASDAQ climbed 0.55%.

Dow Jones Industrial Average heatmap

The Fed is scheduled to announce its interest rate decision on June 18 at 2 p.m. Eastern Time. Market consensus expects the central bank to keep rates steady. The Fed remains concerned about rising inflation, particularly following the introduction of former President Donald Trump’s “Liberation Day” tariffs.

Trump also anticipates no rate cuts. Earlier, he remarked that “stupid” Fed Chair Jerome Powell probably won’t cut rates. That remark is part of the ongoing pressure by the U.S. President on the Fed.

Trump has said interest rates should be at least two percentage points lower to support the economy. However, that scenario appears unlikely, especially as rising oil prices, driven by the Israel-Iran war, add to inflation concerns.

Trump escalates rhetoric over Iran

While markets are focusing on the Fed, tensions in the Middle East threaten to escalate further. Notably, Trump confronted Iran with a threatening tone, refusing to rule out direct U.S. military involvement. He stated that “it’s very late to be talking” with Iran.

“Nobody knows what I’m going to do,” Trump told reporters when asked whether or not the U.S. would strike Iran. U.S. continues to support Israel with its strikes on Iran, which have already done significant damage to its military capabilities. However, Iran is also retaliating against Israel with missiles and drones.

While Qatar and Oman are trying to mediate a ceasefire, they are urging Israel to de-escalate. On the other hand, Israel is doing its best to get the U.S. directly involved in the war, which would likely have immediate consequences on the entire region and the global oil market.

Disclaimer: The articles reposted on this site are sourced from public platforms and are provided for informational purposes only. They do not necessarily reflect the views of MEXC. All rights remain with the original authors. If you believe any content infringes on third-party rights, please contact [email protected] for removal. MEXC makes no guarantees regarding the accuracy, completeness, or timeliness of the content and is not responsible for any actions taken based on the information provided. The content does not constitute financial, legal, or other professional advice, nor should it be considered a recommendation or endorsement by MEXC.
Share Insights

You May Also Like

Microsoft Corp. $MSFT blue box area offers a buying opportunity

Microsoft Corp. $MSFT blue box area offers a buying opportunity

The post Microsoft Corp. $MSFT blue box area offers a buying opportunity appeared on BitcoinEthereumNews.com. In today’s article, we’ll examine the recent performance of Microsoft Corp. ($MSFT) through the lens of Elliott Wave Theory. We’ll review how the rally from the April 07, 2025 low unfolded as a 5-wave impulse followed by a 3-swing correction (ABC) and discuss our forecast for the next move. Let’s dive into the structure and expectations for this stock. Five wave impulse structure + ABC + WXY correction $MSFT 8H Elliott Wave chart 9.04.2025 In the 8-hour Elliott Wave count from Sep 04, 2025, we saw that $MSFT completed a 5-wave impulsive cycle at red III. As expected, this initial wave prompted a pullback. We anticipated this pullback to unfold in 3 swings and find buyers in the equal legs area between $497.02 and $471.06 This setup aligns with a typical Elliott Wave correction pattern (ABC), in which the market pauses briefly before resuming its primary trend. $MSFT 8H Elliott Wave chart 7.14.2025 The update, 10 days later, shows the stock finding support from the equal legs area as predicted allowing traders to get risk free. The stock is expected to bounce towards 525 – 532 before deciding if the bounce is a connector or the next leg higher. A break into new ATHs will confirm the latter and can see it trade higher towards 570 – 593 area. Until then, traders should get risk free and protect their capital in case of a WXY double correction. Conclusion In conclusion, our Elliott Wave analysis of Microsoft Corp. ($MSFT) suggested that it remains supported against April 07, 2025 lows and bounce from the blue box area. In the meantime, keep an eye out for any corrective pullbacks that may offer entry opportunities. By applying Elliott Wave Theory, traders can better anticipate the structure of upcoming moves and enhance risk management in volatile markets. Source: https://www.fxstreet.com/news/microsoft-corp-msft-blue-box-area-offers-a-buying-opportunity-202509171323
Share
2025/09/18 03:50
Share