On-chain analytics firm Santiment has revealed how Bitcoin, XRP, and other cryptocurrencies have dropped into a “buy zone” on a popular metric. MVRV Ratio Shows High Degree Of Short-Term Pain In Bitcoin & Altcoins In a new post on X, Santiment has discussed how the various assets in the cryptocurrency sector are looking based on the 30-day MVRV Ratio. The Market Value to Realized Value (MVRV) Ratio is an on-chain indicator that measures the ratio between the market cap and Realized Cap for a given coin. Related Reading: Bitcoin SSR Flashes Buy Signal: Rebound Incoming? The Realized Cap here refers to a capitalization model that calculates the asset’s total value by assuming the value of each individual token is equal to the price at which it was last transacted on the blockchain. In short, what this model captures is an estimation for the amount of capital that BTC investors as a whole have invested into the cryptocurrency. The usual market cap, on the other hand, represents the amount holders are carrying today. When the value of the MVRV Ratio is greater than 1, it means the market cap is greater than the Realized Cap. In other words, the overall network is in a state of profit. On the other hand, an indicator below this threshold implies the dominance of losses among investors. In the context of the current topic, the version of the MVRV Ratio that’s of interest is the 30-day one, tracking the profit-loss balance of the traders who purchased their coins within the past month. Below is the chart for the metric shared by Santiment that shows the trend in its value for five major cryptocurrencies: Bitcoin, XRP, Ethereum, Chainlink, and Cardano: As is visible in the graph, the 30-day MVRV Ratio has witnessed a plunge recently as the sector has gone through a bearish shift. Recent Bitcoin buyers are now about 11.5% underwater, while XRP ones are around 10.2%. Both of these are beyond the threshold that the analytics firm classifies as the boundary for a “good buy zone.” The 30-day investors have suffered even worse losses in the case of Ethereum, Cardano, and Chainlink, being down 15.4%, 19.7%, and 16.8%, respectively. All of these fall inside Santiment’s “extreme buy zone.” “In a zero sum game, buy assets when average trade returns of your peers are in extreme negatives,” noted the analytics firm. “The lower MVRV’s go, the higher the probability is of a rapid recovery.” Related Reading: Bitcoin Social Dominance Hits 4-Month High: What It Means It now remains to be seen whether market pain has been enough for XRP and others to cause a market rebound, or if more drawdown is coming. XRP Price At the time of writing, XRP is floating around $2.18, down more than 11% over the last week. Featured image from Dall-E, Santiment.net, chart from TradingView.comOn-chain analytics firm Santiment has revealed how Bitcoin, XRP, and other cryptocurrencies have dropped into a “buy zone” on a popular metric. MVRV Ratio Shows High Degree Of Short-Term Pain In Bitcoin & Altcoins In a new post on X, Santiment has discussed how the various assets in the cryptocurrency sector are looking based on the 30-day MVRV Ratio. The Market Value to Realized Value (MVRV) Ratio is an on-chain indicator that measures the ratio between the market cap and Realized Cap for a given coin. Related Reading: Bitcoin SSR Flashes Buy Signal: Rebound Incoming? The Realized Cap here refers to a capitalization model that calculates the asset’s total value by assuming the value of each individual token is equal to the price at which it was last transacted on the blockchain. In short, what this model captures is an estimation for the amount of capital that BTC investors as a whole have invested into the cryptocurrency. The usual market cap, on the other hand, represents the amount holders are carrying today. When the value of the MVRV Ratio is greater than 1, it means the market cap is greater than the Realized Cap. In other words, the overall network is in a state of profit. On the other hand, an indicator below this threshold implies the dominance of losses among investors. In the context of the current topic, the version of the MVRV Ratio that’s of interest is the 30-day one, tracking the profit-loss balance of the traders who purchased their coins within the past month. Below is the chart for the metric shared by Santiment that shows the trend in its value for five major cryptocurrencies: Bitcoin, XRP, Ethereum, Chainlink, and Cardano: As is visible in the graph, the 30-day MVRV Ratio has witnessed a plunge recently as the sector has gone through a bearish shift. Recent Bitcoin buyers are now about 11.5% underwater, while XRP ones are around 10.2%. Both of these are beyond the threshold that the analytics firm classifies as the boundary for a “good buy zone.” The 30-day investors have suffered even worse losses in the case of Ethereum, Cardano, and Chainlink, being down 15.4%, 19.7%, and 16.8%, respectively. All of these fall inside Santiment’s “extreme buy zone.” “In a zero sum game, buy assets when average trade returns of your peers are in extreme negatives,” noted the analytics firm. “The lower MVRV’s go, the higher the probability is of a rapid recovery.” Related Reading: Bitcoin Social Dominance Hits 4-Month High: What It Means It now remains to be seen whether market pain has been enough for XRP and others to cause a market rebound, or if more drawdown is coming. XRP Price At the time of writing, XRP is floating around $2.18, down more than 11% over the last week. Featured image from Dall-E, Santiment.net, chart from TradingView.com

XRP, Bitcoin Now In “Good Buy Zone,” Says Analytics Firm

2025/11/19 10:00

On-chain analytics firm Santiment has revealed how Bitcoin, XRP, and other cryptocurrencies have dropped into a “buy zone” on a popular metric.

MVRV Ratio Shows High Degree Of Short-Term Pain In Bitcoin & Altcoins

In a new post on X, Santiment has discussed how the various assets in the cryptocurrency sector are looking based on the 30-day MVRV Ratio. The Market Value to Realized Value (MVRV) Ratio is an on-chain indicator that measures the ratio between the market cap and Realized Cap for a given coin.

The Realized Cap here refers to a capitalization model that calculates the asset’s total value by assuming the value of each individual token is equal to the price at which it was last transacted on the blockchain. In short, what this model captures is an estimation for the amount of capital that BTC investors as a whole have invested into the cryptocurrency. The usual market cap, on the other hand, represents the amount holders are carrying today.

When the value of the MVRV Ratio is greater than 1, it means the market cap is greater than the Realized Cap. In other words, the overall network is in a state of profit. On the other hand, an indicator below this threshold implies the dominance of losses among investors.

In the context of the current topic, the version of the MVRV Ratio that’s of interest is the 30-day one, tracking the profit-loss balance of the traders who purchased their coins within the past month.

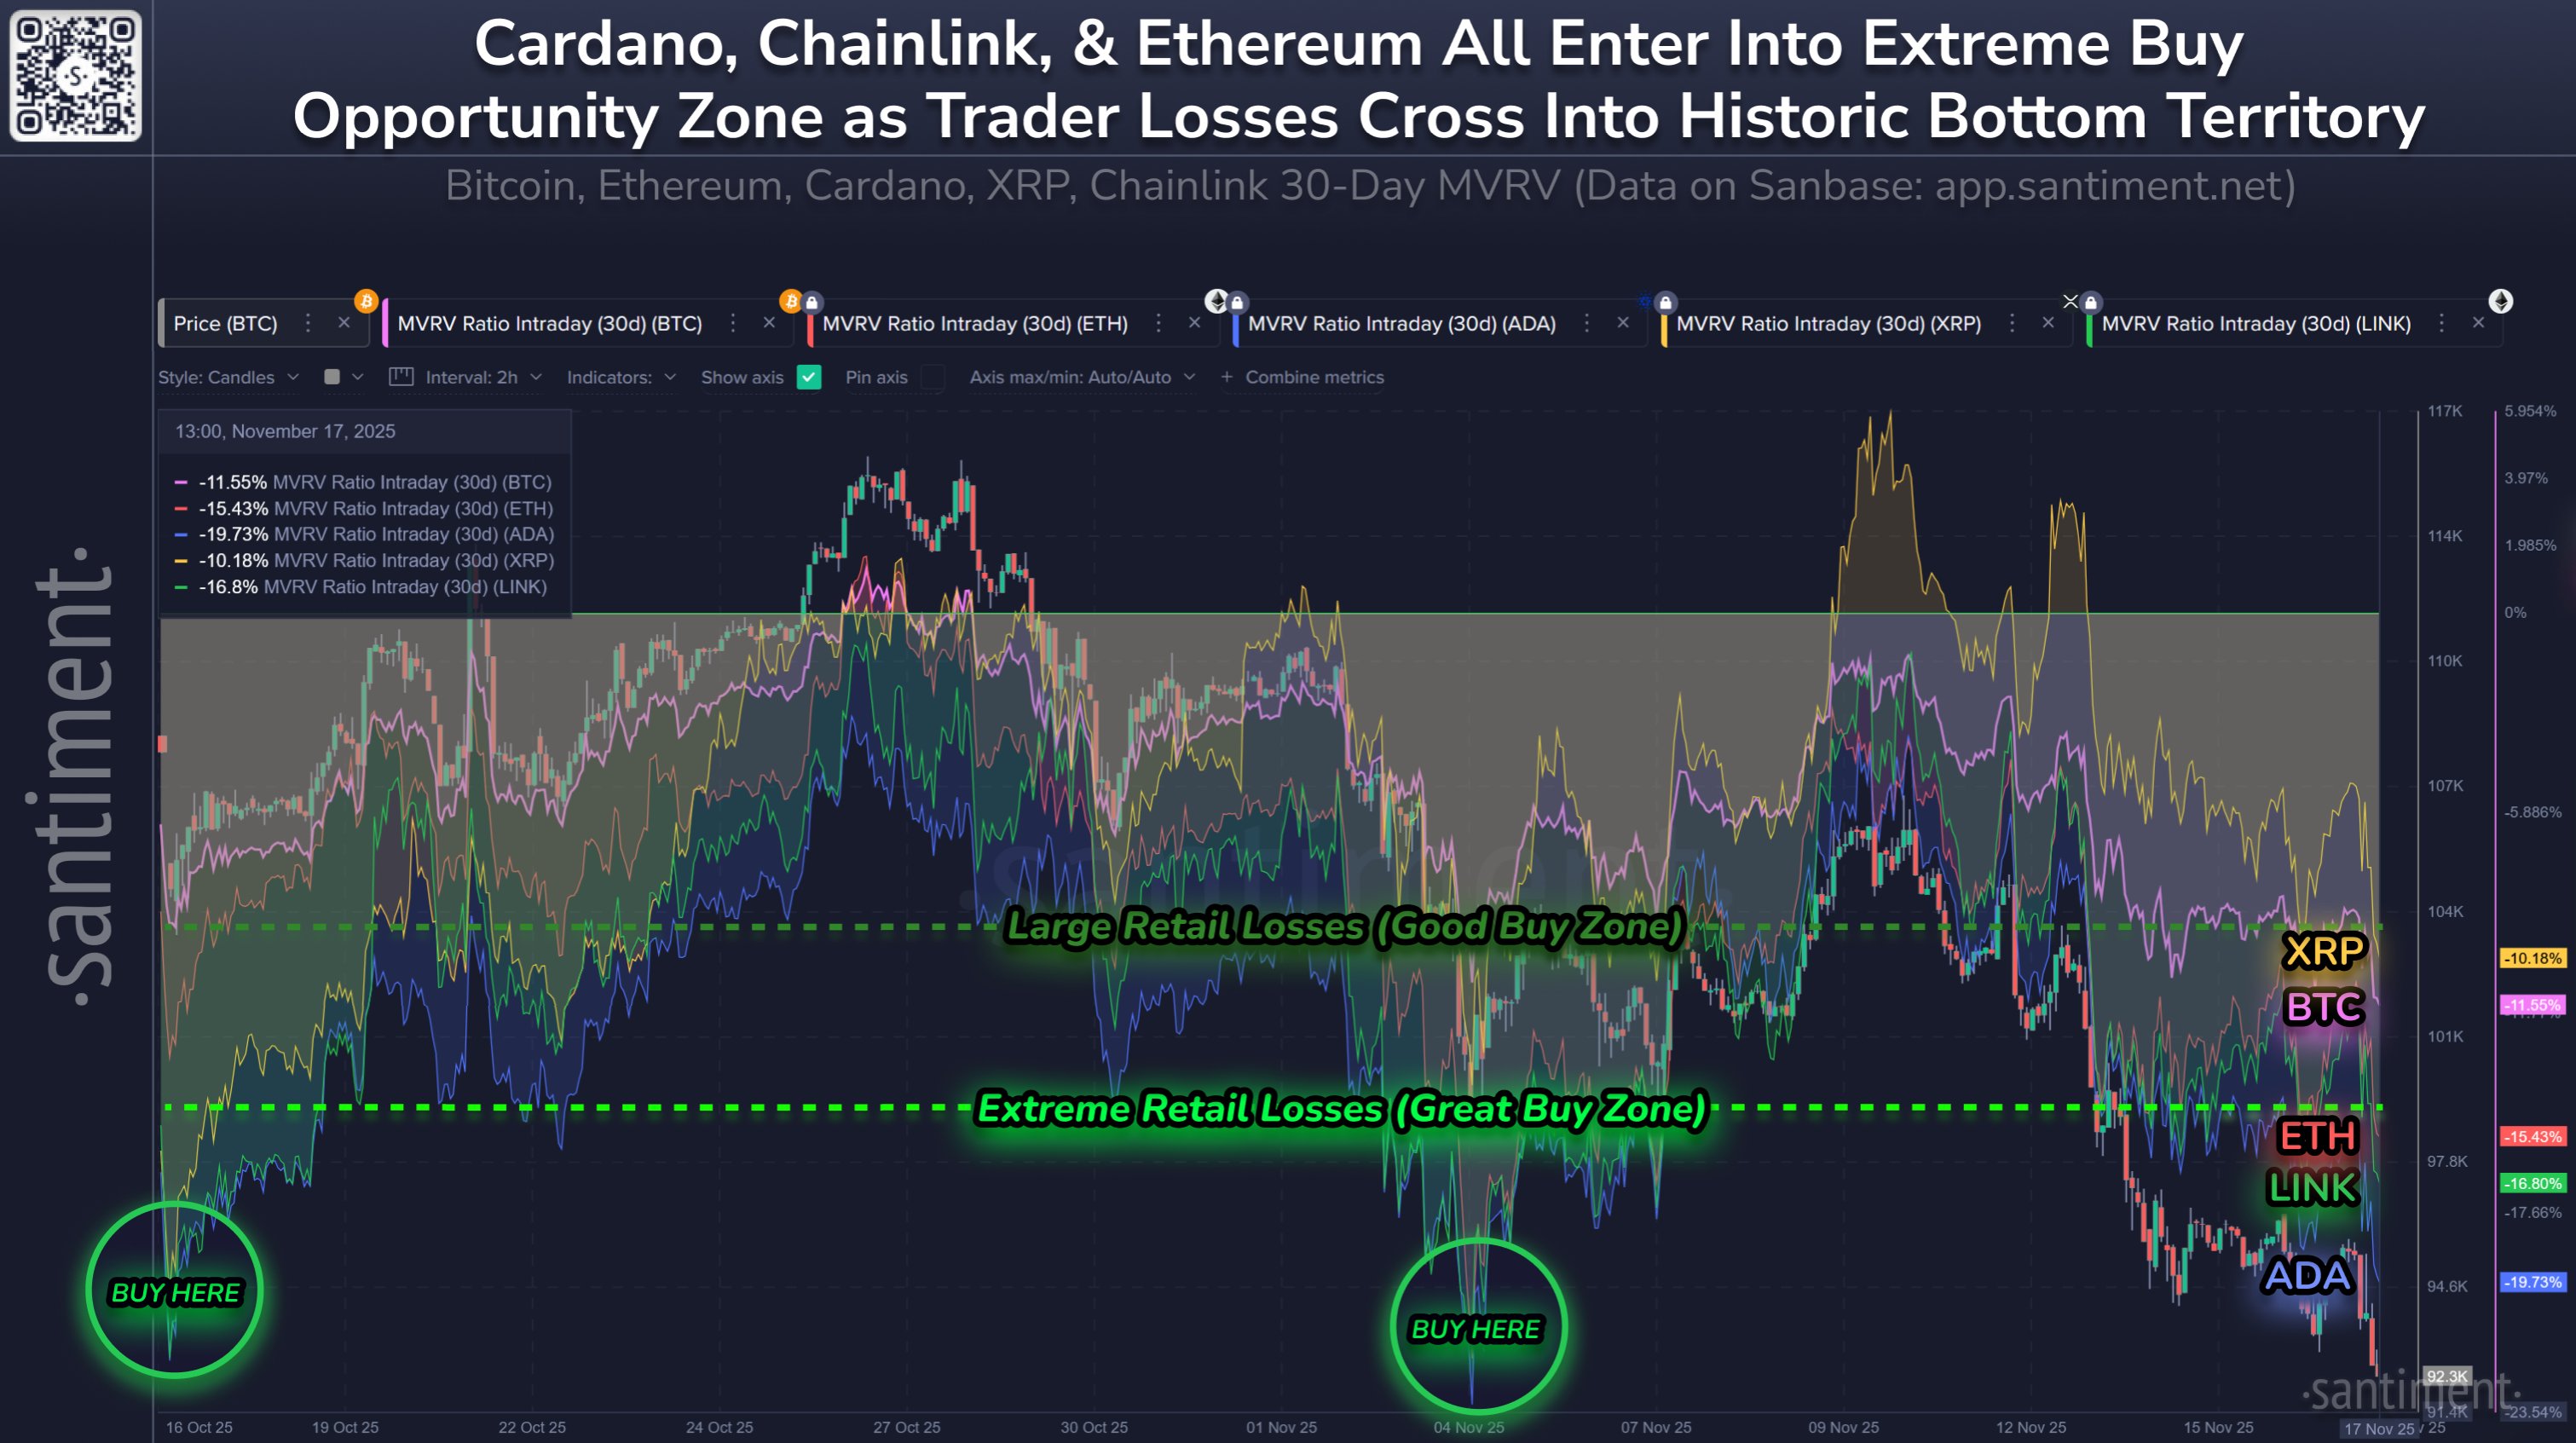
Below is the chart for the metric shared by Santiment that shows the trend in its value for five major cryptocurrencies: Bitcoin, XRP, Ethereum, Chainlink, and Cardano:
XRP, Bitcoin MVRV Ratio

As is visible in the graph, the 30-day MVRV Ratio has witnessed a plunge recently as the sector has gone through a bearish shift. Recent Bitcoin buyers are now about 11.5% underwater, while XRP ones are around 10.2%. Both of these are beyond the threshold that the analytics firm classifies as the boundary for a “good buy zone.”

The 30-day investors have suffered even worse losses in the case of Ethereum, Cardano, and Chainlink, being down 15.4%, 19.7%, and 16.8%, respectively. All of these fall inside Santiment’s “extreme buy zone.”

“In a zero sum game, buy assets when average trade returns of your peers are in extreme negatives,” noted the analytics firm. “The lower MVRV’s go, the higher the probability is of a rapid recovery.”

It now remains to be seen whether market pain has been enough for XRP and others to cause a market rebound, or if more drawdown is coming.

XRP Price

At the time of writing, XRP is floating around $2.18, down more than 11% over the last week.

XRP Price Chart
Disclaimer: The articles reposted on this site are sourced from public platforms and are provided for informational purposes only. They do not necessarily reflect the views of MEXC. All rights remain with the original authors. If you believe any content infringes on third-party rights, please contact [email protected] for removal. MEXC makes no guarantees regarding the accuracy, completeness, or timeliness of the content and is not responsible for any actions taken based on the information provided. The content does not constitute financial, legal, or other professional advice, nor should it be considered a recommendation or endorsement by MEXC.

You May Also Like

RLUSD at Center of New Trading and Lending Alliance

RLUSD at Center of New Trading and Lending Alliance

The post RLUSD at Center of New Trading and Lending Alliance appeared on BitcoinEthereumNews.com. Fintech 18 September 2025 | 15:17 Global finance took another step toward tokenisation this week as Ripple unveiled a three-way collaboration with Singapore’s DBS and U.S. asset manager Franklin Templeton. The initiative combines Ripple’s RLUSD stablecoin with tokenised securities, opening up new trading and lending possibilities for large investors. Rather than focusing on crypto speculation, the project is pitched as infrastructure. Franklin Templeton will make its sgBENJI money market fund available in tokenised form, while DBS Digital Exchange will list it next to RLUSD. For the first time, institutional traders will be able to swap between a yield-bearing fund and a dollar-backed stablecoin in real time, creating a mechanism to rebalance portfolios without stepping outside the ecosystem. Why it matters This setup introduces a way for investors to toggle between safety and yield without the friction of moving funds back into traditional systems. DBS also plans to accept sgBENJI as collateral for credit lines and repo agreements, with the bank acting as custodian for pledged assets. The result could be a smoother pipeline for accessing liquidity while maintaining exposure to tokenised instruments. The strategic layer Ripple has been steadily positioning RLUSD as more than just another stablecoin. Earlier in September, the company announced plans to bring the token into African financial networks, targeting banks and enterprises in need of digital dollar liquidity. Now, with Franklin Templeton and DBS on board, RLUSD gains credibility in mainstream markets. Franklin Templeton will issue sgBENJI directly on the XRP Ledger, citing its low fees and high throughput. This move deepens the ledger’s role in hosting tokenised funds, strengthening interoperability across the ecosystem. Industry voices Executives backing the project have framed it as a turning point. DBS chief Lim Wee Kian argued that financial markets operating around the clock demand solutions designed for constant access…
Share
BitcoinEthereumNews2025/09/18 21:32
This U.S. politician’s suspicious stock trade just returned over 200% in weeks
This U.S. politician’s suspicious stock trade just returned over 200% in weeks

The post This U.S. politician’s suspicious stock trade just returned over 200% in weeks appeared on BitcoinEthereumNews.com. United States Representative Cloe Fields has seen his stake in Opendoor Technologies (NASDAQ: OPEN) stock return over 200% in just a matter of weeks. According to congressional trade filings, the lawmaker purchased a stake in the online real estate company on July 21, 2025, investing between $1,001 and $15,000. At the time, the stock was trading around $2 and had been largely stagnant for months. Receive Signals on US Congress Members’ Stock Trades Stocks Stay up-to-date on the trading activity of US Congress members. The signal triggers based on updates from the House disclosure reports, notifying you of their latest stock transactions. Enable signal The trade has since paid off, with Opendoor surging to $10, a gain of nearly 220% in under two months. By comparison, the broader S&P 500 index rose less than 5% during the same period. OPEN one-week stock price chart. Source: Finbold Assuming he invested a minimum of $1,001, the purchase would now be worth about $3,200, while a $15,000 stake would have grown to nearly $48,000, generating profits of roughly $2,200 and $33,000, respectively. OPEN’s stock rally Notably, Opendoor’s rally has been fueled by major corporate shifts and market speculation. For instance, in August, the company named former Shopify COO Kaz Nejatian as CEO, while co-founders Keith Rabois and Eric Wu rejoined the board, moves seen as a return to the company’s early innovative spirit.  Outgoing CEO Carrie Wheeler’s resignation and sale of millions in stock reinforced the sense of a new chapter. Beyond leadership changes, Opendoor’s surge has taken on meme-stock characteristics. In this case, retail investors piled in as shares climbed, while short sellers scrambled to cover, pushing prices higher.  However, the stock is still not without challenges, where its iBuying model is untested at scale, margins are thin, and debt tied to…
Share
BitcoinEthereumNews2025/09/18 04:02