XRP Price Prediction As SEC Prepares To Rule On Six Spot XRP ETFs In October

The XRP price rose a fraction of a percent in the past 24 hours to trade at $2.79 as of 1:17 a.m. EST even as trading volume plunged 58% to $2.8 billion.
This comes as six applications for spot XRP exchange-traded funds (ETFs) are nearing decision deadlines.
The US Securities and Exchange Commission (SEC) is expected to rule on them between October 18 and October 25, which will determine whether XRP becomes the third cryptocurrency after Bitcoin and Ethereum to gain access to US-listed spot ETFs.
Grayscale’s XRP ETF is scheduled for review on October 18, 21Shares Core XRP Trust ETF on October 19, Bitwise’s XRP ETF on October 22, Canary Capital and CoinShares on October 23, and WisdomTree’s XRP ETF filing on October 24.
Nate Geraci, the president of NovaDius Wealth Management, says ”get ready for October” after positive regulatory developments in the last two weeks that included a series of firsts that he detailed in the following post:
XRP At A Crossroads: Can Bulls Defend The Key Support Zone?
The XRP price on the daily chart shows a market under pressure, trading near $2.79 after a steady decline from its mid-July highs.
The Ripple token price action has formed a descending channel pattern, reflecting a clear bearish trend in recent weeks.
Each rally attempt has been met with selling pressure, keeping XRP locked below the channel’s upper resistance. XRP is hovering just beneath the 50-day Simple Moving Average (SMA) (at $2.96), while the 200-day SMA (at $2.54) remains a crucial long-term support level.
The Fibonacci retracement from the July rally highlights resistance at $3.09 (23.6%), $3.34 (38.2%), and $3.53 (50%). These levels remain critical hurdles if XRP attempts a recovery.
Meanwhile, the Relative Strength Index (RSI) currently sits at 41.5, placing it in bearish territory but not yet oversold. This suggests there could still be room for further downside before strong accumulation appears.
Meanwhile, the 50-day SMA has crossed above the XRP price, acting as dynamic resistance, while the 200-day SMA remains supportive, creating a battle between short-term bearishness and long-term trend stability.
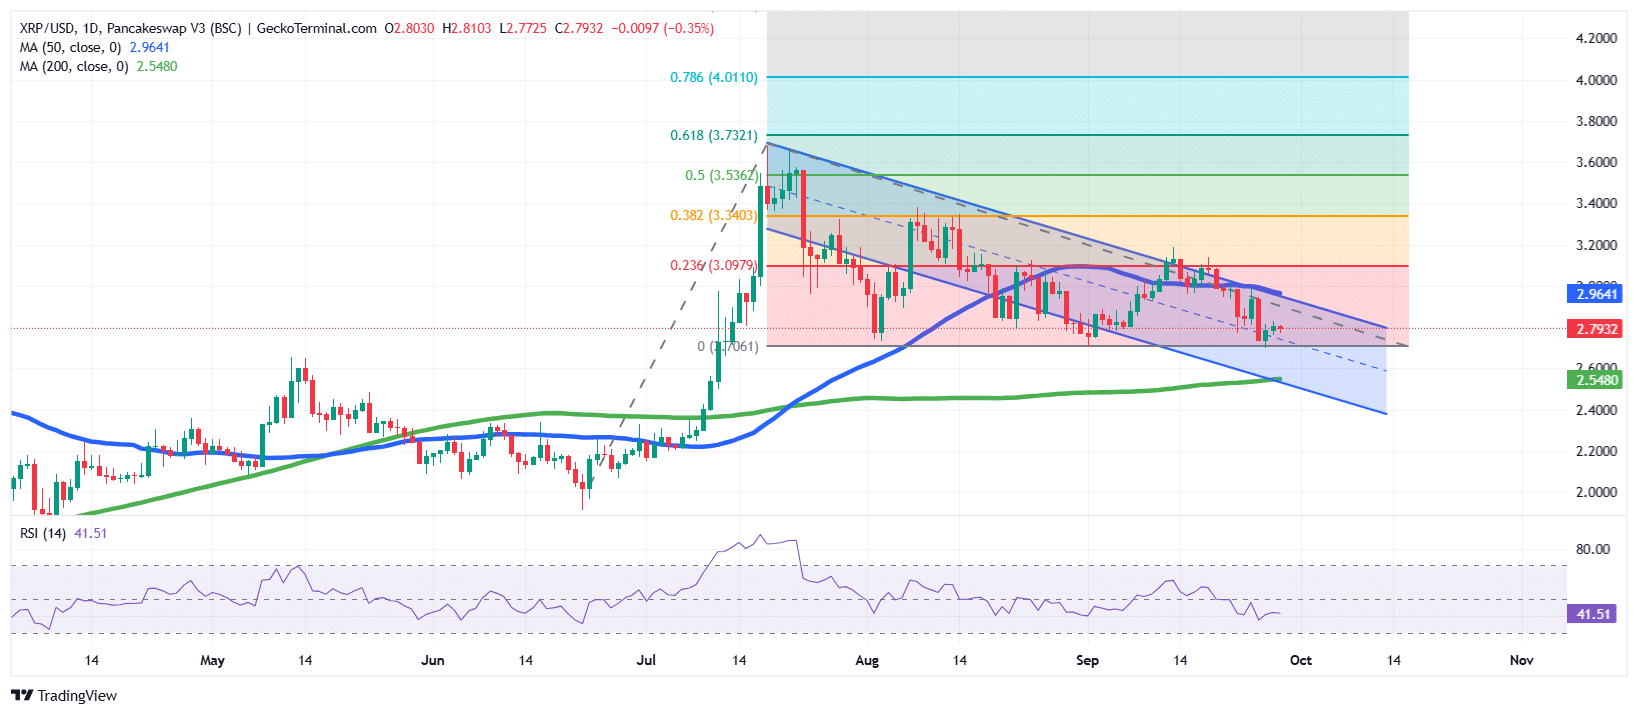 XRP/USD Chart Analysis Source: GeckoTerminal
Looking ahead, XRP’s price action will likely hinge on whether it can hold above the $2.55 support zone, which aligns with the 200-day SMA.
A breakdown below this level could trigger a deeper retracement toward $2.40.
On the upside, reclaiming $3.00 would be the first signal of strength, with a potential breakout above $3.34 opening the path toward $3.53 and beyond. For now, XRP remains at a crossroads, with the market awaiting confirmation of its next major move.
Related News:
You May Also Like

Traders Call It the Top Crypto for 2025 With 45x Potential, While ADA and XRP Could Deliver But Small

MARA Produces 736 BTC While CleanSpark Mines 629 Bitcoin in September