

BNB Price Loses Major Support After 12-Month Low: Why More Downside May Come First
Binance Coin has lost a key level that held firm for months, and the reaction has pushed BNB price into a more vulnerable position. The drop below $570 marks the first time in over a year that price has slipped under that range, and the structure now leans toward further downside unless strong support appears soon.
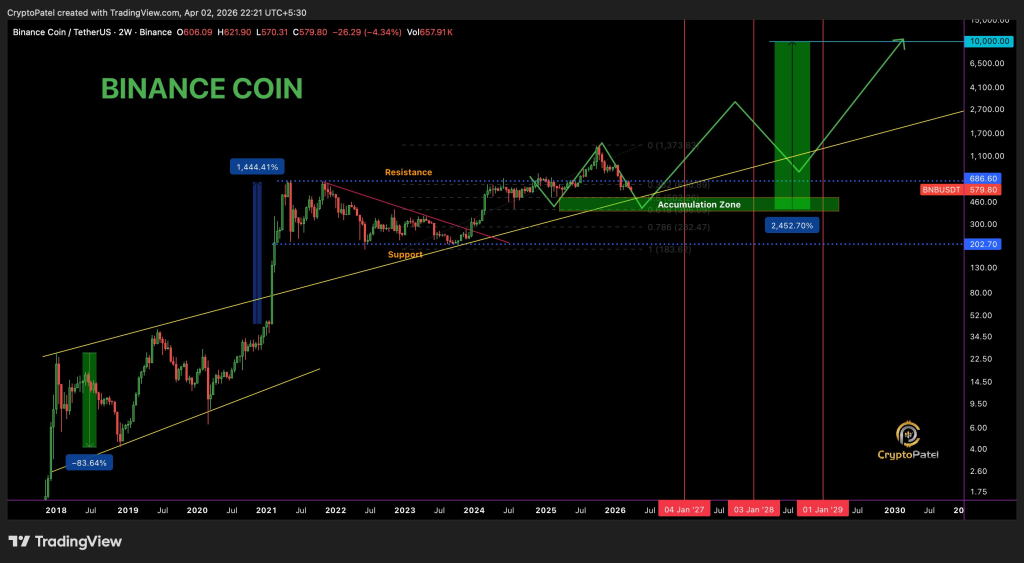
A closer look at the chart shows BNB rejected near a major resistance zone before rolling over sharply. That rejection happened just below the upper boundary around $680, and it confirms that buyers failed to push price into a new range.
BNB Price Structure Shows Clear Path Toward $400 To $500 Accumulation Zone
Crypto Patel pointed out that BNB has now entered a zone where previous retracement levels begin to matter. The 0.5 Fibonacci level aligns close to $500, and the 0.618 level sits slightly lower. That area forms a strong confluence with a long-term ascending trendline that has supported price for years.
 @CryptoPatel / X
The chart also marks this region as an accumulation zone, which makes it a logical place for buyers to step in if the broader structure remains intact. Aura_ledger echoed this view and noted that dips below $570 tend to align with accumulation phases when long-term fundamentals remain stable.
Another observation comes from schn290, who noted that large transactions have started to appear around the $400 to $500 range. That type of activity often shows early positioning before larger moves, although price still needs to confirm any shift in direction.
Indicator Readings Show No Confirmed Reversal Despite Oversold Conditions
The technical indicators offer a more cautious perspective on the current BNB price outlook.
| Indicator | Value | Action |
|---|---|---|
| RSI (14) | 33.58 | Sell |
| Stochastic (9,6) | 38.47 | Sell |
| MACD (12,26) | -9.61 | Sell |
| ADX (14) | 35.174 | Sell |
| CCI (14) | -166.37 | Sell |
| Highs/Lows (14) | -25.545 | Sell |
| Ultimate Oscillator | 40.121 | Sell |
RSI near 33 shows that BNB is approaching oversold territory, but it has not reached levels where strong reversals usually begin. MACD remains negative, which confirms that downward pressure still dominates.
ADX above 35 signals a strong trend, and that trend currently points downward. CCI and Highs Lows readings also remain deeply negative, which supports the view that weakness has not yet exhausted itself.
That combination matters because accumulation narratives often appear before indicators confirm a reversal. At this stage, indicators do not yet support a confirmed bounce.
BNB Price Outlook Suggests Deeper Dip Possible Before Any Recovery Attempt
BNB now sits at a critical point where short-term weakness meets long-term expectations. Crypto Patel raised the possibility of a move toward much higher levels over time, even pointing to a potential path toward $10,000 if historical structures repeat.
That outlook depends heavily on whether BNB can stabilize within the $400 to $500 zone. A controlled move into that range followed by consolidation could create a base for recovery.
Failure to hold that area would change the structure entirely. A break below $400 would weaken the long-term trendline and open the door for deeper declines.
Read Also: This Hedera Signal Just Turned Green Again: Last Two Times HBAR Price Pumped 800% and 124%
Current conditions show a clear conflict. Analysts continue to point toward accumulation, yet indicators show no confirmed reversal. That gap between expectation and confirmation often defines the most uncertain phase of a market cycle, and the next reaction around key support levels will likely decide where BNB price heads next.
Subscribe to our YouTube channel for daily crypto updates, market insights, and expert analysis.
The post BNB Price Loses Major Support After 12-Month Low: Why More Downside May Come First appeared first on CaptainAltcoin.


Ayrıca Şunları da Beğenebilirsiniz

USDC Treasury mints 250 million new USDC on Solana

$280M drained via social engineering


