

Crypto Price Prediction For Today, April 4: XRP, Ethereum (ETH), BNB
XRP, Ethereum, and BNB started April under pressure as all three continue trading below their 30-day moving averages. Price action over the last few sessions shows fading strength. That development puts the market in a cooling phase, with momentum indicators also pointing in the same direction.
A closer look at the charts shows negative MACD readings across all three assets. That detail confirms weakening trend strength across the board. XRP remains slightly soft, Ethereum holds a more balanced structure, and BNB continues to show the clearest downside pressure.
XRP Price Outlook Shows Sideways To Slightly Bearish Structure With Key Levels In Focus
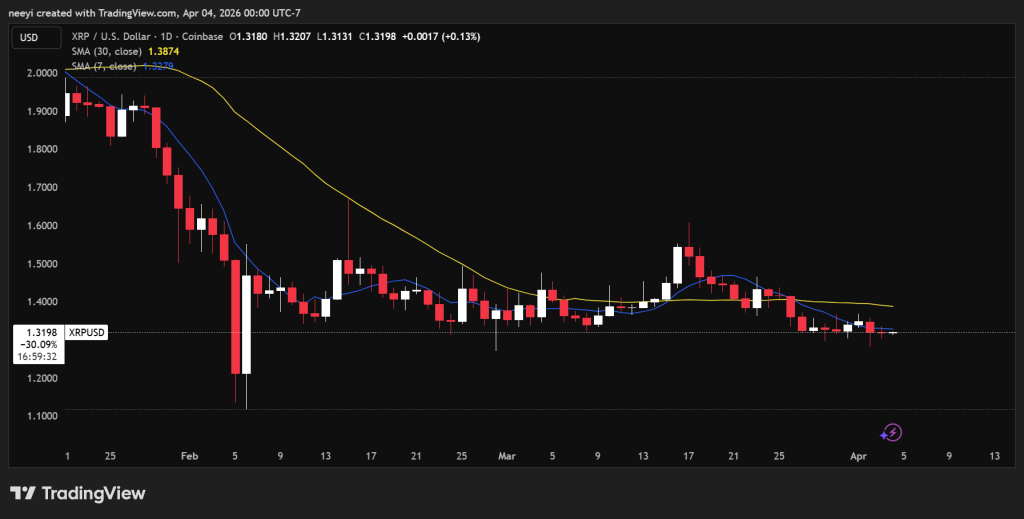
XRP price has declined about 7% over the past 30 days. Price now trades around $1.32, which keeps it below the 30-day average near $1.39. The 7-day average around $1.33 also sits below the longer-term average, which confirms that recent closes remain weaker than the prior month.
| Metric | Value |
|---|---|
| Current XRP Price | $1.32 |
| 30-Day Performance | −7% |
| 7-Day SMA | $1.33 |
| 30-Day SMA | $1.38 |
| Trend Structure | Sideways to Slightly Bearish |
| RSI (14) | 39 (Near Oversold) |
| MACD | Below Zero (Bearish Momentum) |
The past week has not changed that picture much. XRP moved within a narrow band between $1.32 and $1.35, with the attempt to hold above $1.35 fading quickly. Price now sits close to the lower end of that range, which keeps short term pressure in place.
Momentum indicators support this view. RSI stands near 39, which leans toward oversold conditions without reaching extreme levels. MACD remains below zero, which shows that sellers still maintain a slight advantage.
 XRP Price Chart / Source: TradingView.com
Key levels now define the next move. Immediate support sits near $1.31, which has held as a recent intraday floor. A break below this level could push XRP toward the $1.28 to $1.30 zone. Resistance stands between $1.34 and $1.35, with stronger resistance near $1.39 to $1.40 around the 30-day average.
XRP Price Prediction For Today
XRP price may continue trading between $1.31 and $1.35 over the next several hours. A move above $1.35 with stronger volume could open the path toward $1.39 or $1.40. A break below $1.31 could lead to a move toward $1.28 to $1.30, where buyers may attempt to stabilize price.
Ethereum Price Outlook Shows Consolidation After Recent Upside Attempt With Clear Levels
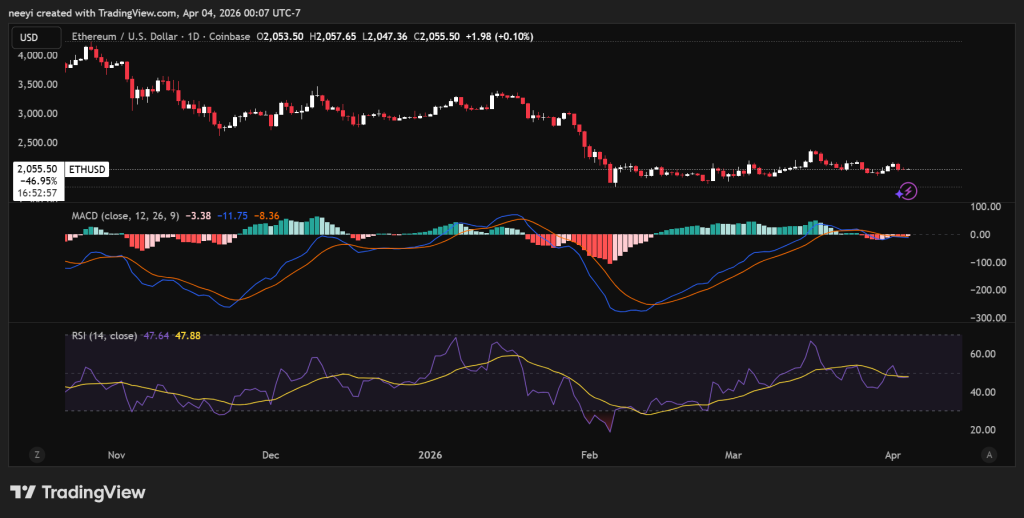
Ethereum price has held up better than XRP over the past month, with a decline of about 3%. Price now trades near $2,053, which places it slightly below the 30-day average around $2,088 and very close to the 7-day average near $2,050.
The last 7 days show a small recovery followed by a pause. Ethereum moved from around $1,980 up to $2,139 before pulling back toward the $2,050 region. That pattern shows that buyers attempted to push higher but lost strength near resistance.
| Metric | Value |
|---|---|
| Current Ethereum Price | $2,053 |
| 30-Day Performance | −3% |
| 7-Day SMA | $2,050 |
| 30-Day SMA | $2,088 |
| Trend Structure | Sideways to Slightly Bearish |
| RSI (14) | 47 (Near Neutral) |
| MACD | Below Zero (Weak Momentum) |
Momentum indicators reflect this balance. RSI sits near 47, which places it just below neutral. MACD remains negative, which confirms that the earlier upward push has weakened.
Key levels are now clearly defined. Immediate support sits around $2,020, which aligns with recent lows and the 7-day average. A deeper support zone stands around $1,960. Resistance appears at $2,090, with stronger resistance near $2,160
 ETH Price Chart / Source: TradingView.com
Ethereum (ETH) Price Prediction For Today
Ethereum price may trade between $2,020 and $2,100 during today’s session. A move above $2,100 could open a path toward $2,160. A break below $2,020 could push ETH toward $1,960, where stronger support may come into play.
Binance Coin Price Outlook Shows Stronger Downtrend With Oversold Conditions And Key Levels
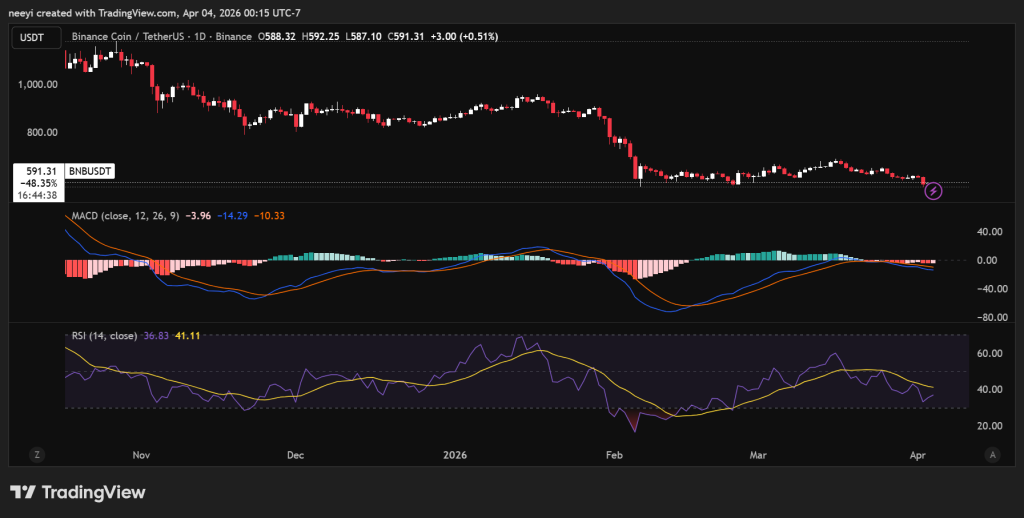
BNB price continues to show the weakest structure among the three assets. A drop of over 9% in the past 30 days places it firmly in a corrective phase. Price now trades near $591, which keeps it below both the 7-day average around $603 and the 30-day average near $633.
The last 7 days reinforce that weakness. BNB moved down from the $605 to $617 region toward a low near $583 before stabilizing slightly. That movement confirms a clear short term downtrend rather than a sideways pattern.
| Metric | Value |
|---|---|
| Current BNB Price | $591 |
| 30-Day Performance | −9% |
| 7-Day SMA | $603 |
| 30-Day SMA | $633 |
| Trend Structure | Bearish Downtrend |
| RSI (14) | 35 (Near Oversold) |
| MACD | Deeply Negative (Strong Bearish Momentum) |
Momentum indicators point to stronger selling pressure. RSI sits near 35, which approaches oversold levels but does not yet signal exhaustion. MACD remains deeply negative, which shows that bearish momentum is still in control.
Key levels now become critical. Immediate support stands near $580, which has acted as a recent floor. A break below this level could push price toward the $560 zone. Resistance appears between $600 and $605, with higher resistance near $630 to $635 around the 30-day average.
 BNB Price Chart / Source: TradingView.com
BNB Price Prediction For Today
BNB price may trade between $580 and $600 during today’s session. A move above $600 could allow a recovery toward $620 or even $630. A break below $580 could extend the decline toward $560, where stronger support may emerge.
Short term movement may stay within defined ranges unless a clear break occurs. The next move will likely depend on whether buyers can reclaim resistance zones or whether support levels begin to give way.
Subscribe to our YouTube channel for daily crypto updates, market insights, and expert analysis.
The post Crypto Price Prediction For Today, April 4: XRP, Ethereum (ETH), BNB appeared first on CaptainAltcoin.


Ayrıca Şunları da Beğenebilirsiniz

Watching Hyperliquid (HYPE) Candles From the Sidelines Sucks: BlockchainFX ($BFX) Is the Top Crypto to Buy Now

Is Capital Rotating? SHIB Investors Move to Utility Tokens


