

Solana Spot Volume Drops Below $10B: What’s Next for Price?
Solana spot volume falls below $10B after months of decline, while SOL trades near $87 and stays below the key $125 resistance.
Solana spot volume has dropped below $10 billion after months of slower exchange activity.
The decline follows a busy period in mid to late 2025, when SOL trading stayed above that level.
Traders are now watching whether lower volume will lead to a recovery or another price move lower.
Solana Spot Volume Falls Below $10B
Solana spot volume on exchanges stayed above $10 billion during mid to late 2025.
The rise came during strong retail interest and broad attention on the Solana network. At that time, SOL had active trading across major markets.
However, the latest data shows that volume has declined for several months.
This points to less trading activity and lower market interest. It also shows that fewer buyers and sellers are active at current prices.
Lower volume can make the market more sensitive to large orders. As a result, price moves can become sharper during quiet periods.
Traders often watch these phases because they can come before stronger market moves.
For now, the drop in volume does not confirm a price direction. Still, it shows that Solana is in a quieter trading phase. A return in volume may be needed for a stronger price recovery.
SOL Price Remains Below Key Resistance
SOL/TetherUS is trading near $87.65 on the daily chart. The price remains below the key $125 area.
This level acted as support during much of the 2024 to 2025 range. After the break below $125, the same level may now act as resistance.
This means rallies toward that zone may face selling pressure. Therefore, traders are watching how SOL reacts near $100 and $125.
The current price range between $85 and $90 shows short-term consolidation. This follows a sharp decline from higher levels. A daily close above $95 to $100 would show early buying strength.
Even so, a stronger recovery needs more confirmation. SOL would need to move back above $115 to $125. Until that happens, the wider daily trend remains weak.
Read Also:
Indicators Show Mixed Solana Momentum
The MACD on the daily chart remains soft. The MACD line is still slightly below the signal line. Meanwhile, the histogram remains mildly negative.
This shows that selling pressure has slowed, but buyers have not taken control.
A stronger signal would come from a bullish MACD cross. It would carry more weight if it moved above the zero line.
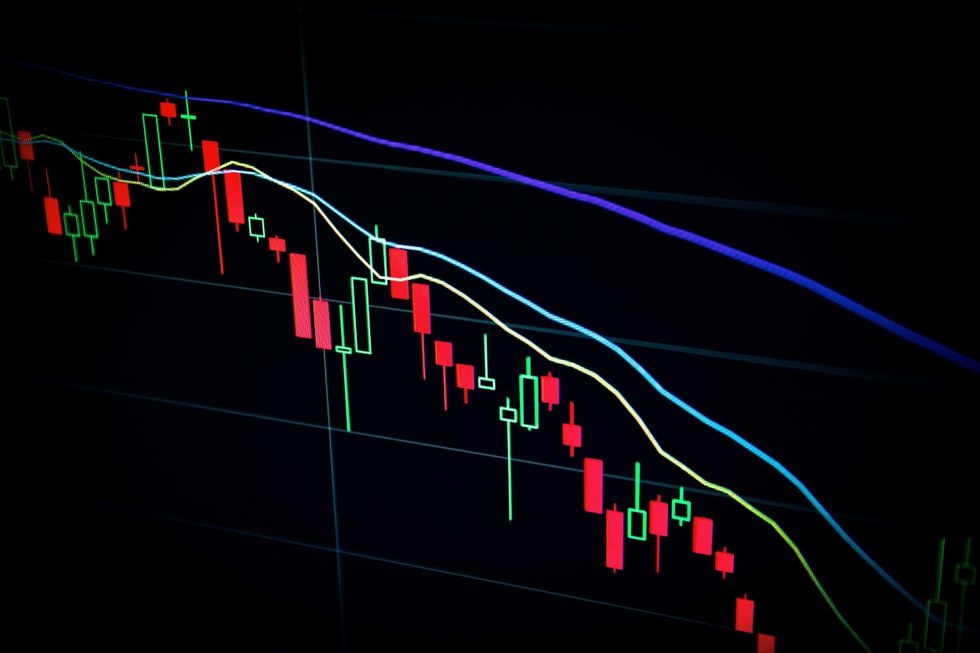
 SOL trades near $87 as volume weakens below key resistance. Source: TradingView
The RSI is near 49.7, which places momentum in a neutral zone. Its average is near 54.4, so the reading is not strongly bearish.
However, it also does not show clear bullish strength. Solana’s next move may depend on whether spot volume returns. Higher trading activity could help confirm a recovery attempt.
Yet, without stronger volume, price may struggle near resistance. The first levels to watch are $95 to $100, then $115 to $125.
The post Solana Spot Volume Drops Below $10B: What’s Next for Price? appeared first on Live Bitcoin News.


Ayrıca Şunları da Beğenebilirsiniz

Analyst expects Warsh to cut rates even as consensus foresees hikes

Alarm as GOP lawmakers hand themselves cash offer: 'Republicans in Congress did what???'
'Biggest wealth divide in modern history': Shocking graphic shows reality of US economy


Popüler Haberler
Daha fazla
