

ARKM Bearish Divergence Signals Possible Price Drop
Crypto traders are closely watching ARKM’s recent market structure, as a bearish divergence reportedly formed on the four-hour timeframe recently. In this setup, price created a higher high while the RSI printed a lower high, and this pattern often signals weakening bullish momentum before pullbacks occur.
At the same time, ARKM rallied aggressively toward the $0.1500 resistance zone, but the price faced immediate rejection near those resistance levels. Moreover, RSI momentum had already started declining before the peak formed, which further strengthened the bearish divergence narrative among traders.
As a result, technical analysts now expect increased downside pressure on ARKM, while the setup suggests possible short-term distribution activity. Momentum indicators also continue flashing weakness across lower timeframes, and traders are monitoring confirmation signals closely.
RSI Divergence Crypto Traders Watch Closely
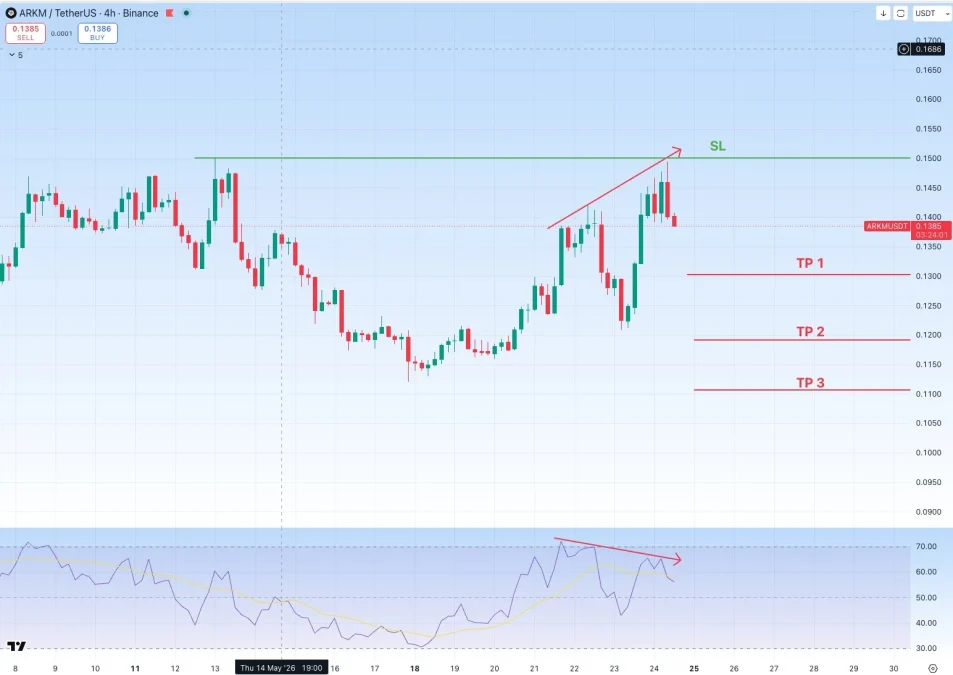
RSI divergence remains one of crypto’s most widely used technical indicators, as it helps traders identify weakening momentum during market trends. Specifically, bearish divergence happens when price rises while RSI declines, and this often signals buyer exhaustion before corrections appear. In ARKM’s case, the divergence appeared near a strong resistance zone, which increases the setup’s technical significance substantially. Consequently, analysts believe large traders may have distributed positions near the highs, while momentum slowed even as price attempted to push higher. However, RSI divergence alone does not guarantee a reversal, and most traders combine it with support and resistance analysis for stronger confirmation. In addition, volume trends and candlestick patterns improve reliability significantly, although strong bullish trends can sometimes invalidate divergence patterns temporarily.
ARKM Price Analysis and Resistance Rejection
ARKM’s rejection near the $0.1500 level quickly attracted trader attention, as the zone acted as strong resistance during the rally. Despite bullish momentum earlier in the move, price failed to sustain strength above that area, and selling pressure emerged almost immediately after the rejection. Following the pullback, some traders are now targeting lower support zones gradually, with downside targets including the $0.13 and $0.12 levels. Meanwhile, more bearish outlooks point toward a possible retest of the $0.111 zone, making risk management especially important during volatile market conditions.
ARKM Tokenomics and Market Pressure
ARKM remains the native token of Arkham Intelligence, a platform focused on blockchain intelligence and wallet analytics. Additionally, its ecosystem includes an intel marketplace powered by ARKM, while the token also supports governance and reward mechanisms across the platform. The project maintains a fixed maximum supply of one billion tokens, and a large portion of the supply is already unlocked. However, ongoing vesting schedules may continue creating gradual sell pressure, which can periodically influence short-term market sentiment. Despite current bearish technical signals, long-term adoption trends still remain important for ARKM’s future outlook. Platform growth could eventually strengthen utility-driven demand, but traders currently remain focused mainly on price action, while technical momentum continues dominating near-term market discussions.
Market Volatility Keeps Traders on Edge
ARKM continues experiencing sharp price fluctuations, and short-term traders remain highly active across the broader crypto market. As a result, technical setups like RSI divergence often influence market sentiment rapidly, which increases volatility during uncertain trading conditions. Meanwhile, many traders are waiting for stronger confirmation signals before taking major positions. A breakdown below key support zones could trigger additional downside momentum, while a bullish recovery above resistance may invalidate the bearish setup entirely. Therefore, market structure remains highly reactive in the short term.
The post ARKM Bearish Divergence Signals Possible Price Drop appeared first on Coinfomania.


Ayrıca Şunları da Beğenebilirsiniz

Rogers backs Kane to outshine Haaland in World Cup showdown

6 Crypto Sportsbooks Ranked on On-Chain Transparency

Russia bans diesel exports as Ukrainian strikes intensify fuel crisis


Popüler Haberler
Daha fazla
