

NEAR Breaks Out of Cup and Handle, Rallies 65% as Traders Watch
NEAR gains 65% after a daily cup and handles breakout, with traders watching $2.60 resistance and $2.327 support.
NEAR rose sharply after a daily cup and handle breakout, drawing attention from traders watching key chart levels.
The NEAR/USDT pair gained about 65% from the breakout zone, based on the shared daily chart.
Price also moved above important Fibonacci levels, while buyers continued to defend the former resistance area.
NEAR Clears Cup and Handle Neckline
NEAR moved above the neckline of a cup and handle pattern on the daily chart. The pattern formed after price built a rounded base over several sessions.
Then, price paused near resistance before buyers pushed it higher. The breakout was followed by a retest of the neckline area.
That retest was held, which kept the price above the breakout zone. As a result, traders continued to track the move for further strength.
The rally carried NEAR toward $2.37 on the Binance daily chart. This marked a gain of about 65% from the breakout area.
One market analyst said, “NEAR held the retest cleanly after breaking the neckline.”
Fibonacci Levels Shape the Current Setup
NEAR is now trading above the 0.382 Fibonacci level near $2.327. This level has become a near-term support area for the market.
Therefore, traders are watching whether price can stay above it. The next resistance is near the 0.236 Fibonacci level at $2.598.
A daily close above $2.60 could bring $3.00 into focus. However, sellers may appear near that area due to previous price action.
Support below the current price sits near $2.10 and $1.89. These levels match the 0.5 and 0.618 Fibonacci zones. A drop below them would place pressure on the current recovery structure.
Read Also:
Momentum Stays Firm as Traders Watch $2.60
The MACD remains positive on the daily chart. Its main line is above the signal line. Also, the histogram remains above zero, which shows continued buying pressure.
The RSI is near 81, based on the chart. This reading shows that NEAR has moved quickly in recent sessions. However, high RSI levels can also lead to short pauses.
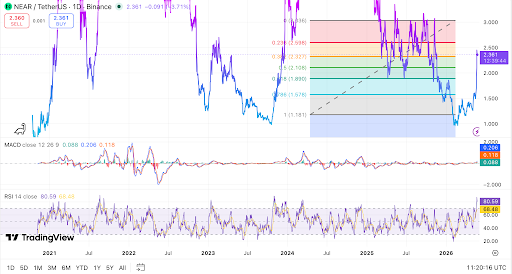 NEAR tests Fibonacci resistance after daily cup and handle breakout. Source: TradingView
For now, the $2.60 level remains the next key test for NEAR. A move above it could send attention toward $3.00.
If price loses $2.327, traders may watch $2.10 as the next support. NEAR’s daily structure remains under close watch after the 65% rally.
The breakout zone is still important for traders tracking the pattern. Price action around $2.60 may decide the next short-term move.
The post NEAR Breaks Out of Cup and Handle, Rallies 65% as Traders Watch appeared first on Live Bitcoin News.


Ayrıca Şunları da Beğenebilirsiniz

Solana price confirms bearish crossover following Drift exploit, will it crash?

Trump Weighs Potential New Strikes on Iran Amid Security Talks

Samsung Agrees to Massive Semiconductor Worker Bonus Deal


Popüler Haberler
Daha fazla
