

SUI Compression Tightens As Bulls Eye Breakout Above Key EMA Resistance
SUI price compresses below $1.10 EMA resistance while bulls defend $1.00 support, with $1.20 as the next key level.
SUI is trading near a tight decision zone as price compresses below key moving average resistance.
The SUI/USDT setup shows reduced volatility, lower volume, and firm support near $1.00.
Market attention is now on whether buyers can push SUI above the 100 EMA and confirm a short-term breakout.
SUI Price Compresses Below 100 EMA Resistance
SUI is moving in a narrow range after a rebound from the $1.15 area on the 4-hour chart.
Price is now sitting near the $1.10 region, where the 100 EMA is acting as resistance. This area has become a key level for short-term traders.
The current SUI price action shows compression, as buyers and sellers remain close in strength.
Volume has also declined during the range. Lower volume during compression often appears before a larger move, although direction remains unconfirmed.
A clear close above the 100 EMA could shift short-term structure in favor of buyers. Market watchers are tracking whether SUI can hold above $1.10 with stronger volume.
A move without volume may leave the breakout exposed to a pullback. The next resistance sits near $1.20.
This level has acted as a barrier during recent recovery attempts. A move above it could support a stronger recovery phase.
Bulls Defend $1.00 As Market Tests Support
The $1.00 area remains the main support zone for SUI. It also aligns with the 0.618 Fibonacci retracement mentioned by traders.
This level has attracted dip buyers during recent weakness. A loss of $1.00 would weaken the current structure.
It could also increase selling pressure toward prior lows. The next downside area sits near $0.90, where price has found support before.
Daily chart structure still shows caution. SUI remains below several major recovery levels after a sharp decline from previous highs.
The broader trend remains neutral to bearish until price forms higher highs and higher lows. The $0.90 to $1.00 range remains important for the wider setup.
A daily close below this area could open room toward $0.75 to $0.80. That would place sellers back in control of the market structure.
Read Also:
RSI And MACD Show Mixed Momentum
Momentum indicators show a balanced setup. The RSI is near the middle range, which shows neither strong buying nor heavy selling.
A move above 60 would support stronger bullish momentum. The MACD is also near the zero line.
This suggests that downside pressure has cooled, but momentum has not turned strong. Traders are watching for a wider MACD crossover and rising histogram bars.
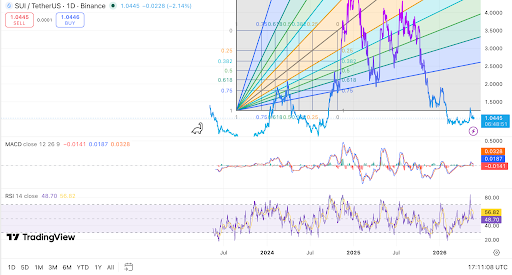 SUI daily chart shows compression near support and EMA resistance. Source: TradingView
The current setup does not confirm a full trend reversal. It shows a possible base after a broad decline. Buyers need a confirmed break above resistance before the chart improves.
For now, SUI remains trapped between support near $1.00 and resistance near $1.10 to $1.20.
A breakout above the EMA with volume could target $1.20 and then $1.30. A rejection could send the price back toward the lower support range.
The post SUI Compression Tightens As Bulls Eye Breakout Above Key EMA Resistance appeared first on Live Bitcoin News.


Ayrıca Şunları da Beğenebilirsiniz

Iran’s army chief warns of ‘total destruction’ for ground invasion
![[Rear View] ‘Na-peste ang Senado’](https://www.rappler.com/tachyon/2026/05/HUMOR-POLITICS.jpg?resize=75%2C75&crop_strategy=attention)
[Rear View] ‘Na-peste ang Senado’

RBI Governor Malhotra: Indian Rupee May Be Undervalued, Signals Policy Shift


Popüler Haberler
Daha fazla
