

Solana Price Finally Flashes a Bullish Sign We’ve Been Waiting For!
olana price action has been pretty boring this week. The token is trading in a narrow range between $76 and $78 for most of the week. The wider crypto market is showing similar behavior – Bitcoin dipped below $62,000, Ethereum fights over $1,800, and altcoins are mostly quiet.
But Solana holders should watch closely what Santiment just reported. I also took a look at what is going on with the Solana chart right now.
Santiment: FUD Hits 2026 High – Historically a Bullish Sign
Santiment reported that Solana is getting hit with a rough sentiment combo. Trading volume has fallen to its lowest level of 2026, while negative commentary just spiked to its highest day of the year.
A big part of the frustration is that SOL has had strong narratives around tokenized stocks and RWA activity, but the Solana price still has not rewarded traders in a meaningful way.
The attached Santiment chart shows trading volume dropping to 2026 lows while the negative sentiment line spikes upward. The green bar on the chart highlights the peak in negative commentary – the highest of the year. This is happening as SOL price remains stuck in a tight range, frustrating traders who expected more from the tokenized stock narrative.
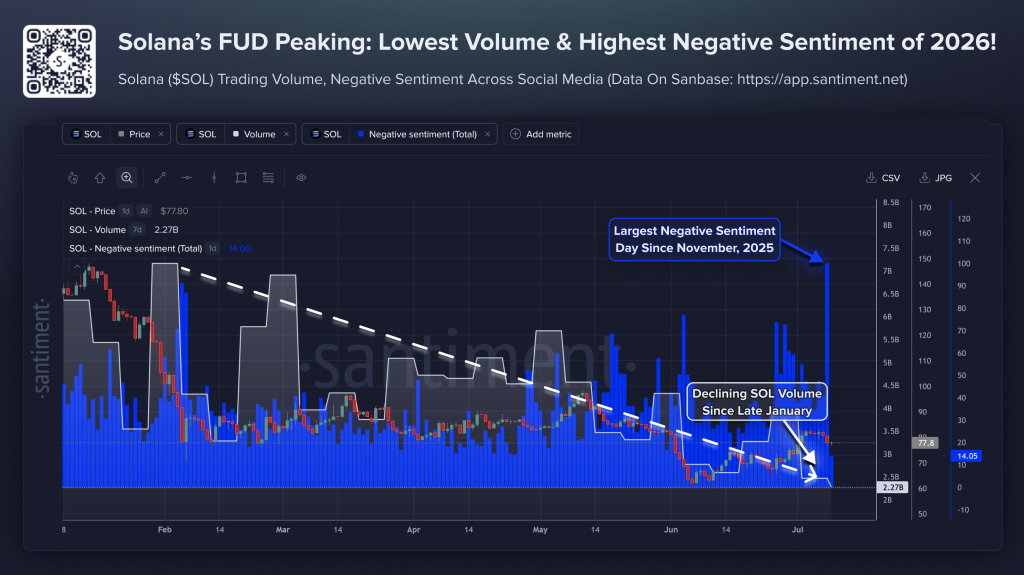 Source: X/@SantimentData
Ironically, this is what makes the setup interesting. When sentiment is overly negative and trading activity is thin, there is often less retail resistance standing in the way if large stakeholders decide to push price higher. With traders least expecting a rebound, SOL could be in the kind of low-attention, high-FUD zone where sharp moves can happen quickly.
Solana Price Analysis: Base Building After Capitulation
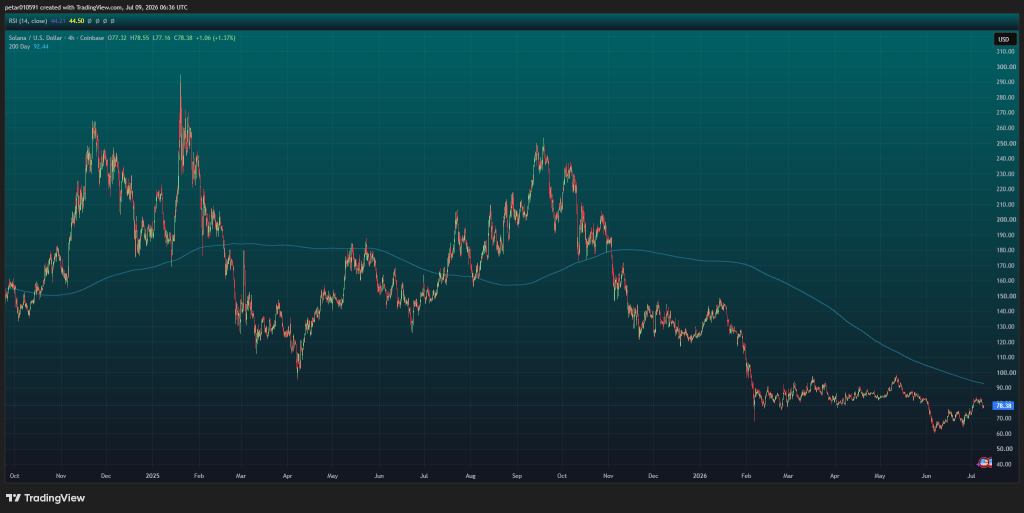
The long-term trend is bearish but transitioning to neutral. The chart has been making lower highs and lower lows since the $250 region. The SOL price remains below the 200-day moving average, currently around $92.4. However, the aggressive downtrend has slowed dramatically over the last few months.
This is an important distinction. The trend is still bearish, but momentum is improving. That is usually how major bottoms begin.
Solana Price Action Phases
The chart can roughly be divided into four phases. First, there was distribution between $200 and $250 – a large topping pattern where every rally was sold and institutional supply dominated. Second, a strong markdown followed where price collapsed through $200, $180, $150, $120, and $100 with very little buying interest.
Third, capitulation around February. This is probably the most important section. The Solana price crashed into roughly $65-$70 – a huge selloff that immediately recovered. That long lower wick often represents panic selling, forced liquidations, and strong buyers stepping in. Capitulation lows often become major support.
Fourth, base building – where SOL sits now. Instead of continuing lower, price has been trading roughly between $68 and $85 for months. Selling pressure has weakened. Buyers are absorbing supply. Markets usually spend a long time here before deciding the next major move.
 Source: TradingView
The current RSI is approximately 44 – not overbought, not oversold, with slight bearish momentum. Earlier declines pushed RSI into oversold. Now price is making similar lows while RSI is holding higher. That hints at possible bullish momentum divergence, although confirmation would require a decisive breakout.
The 200-day moving average sits at approximately $92.4 and is currently acting as dynamic resistance. Price has remained underneath it for months. Every major recovery has failed before reclaiming it. A daily or weekly close above the 200-day MA would be one of the strongest technical improvements on this chart.
Major support sits at $65-$70 – the capitulation low, multiple rebounds, and high volume buying likely occurred here. Secondary support is around $73-$75, the current area where price has repeatedly bounced. If $65 breaks convincingly, the next significant demand zone is $58-$60.
First resistance is $82-$85 – the current ceiling where price has failed several times. Major resistance is $90-$95, which is the most important level because of psychological $90, the 200-day moving average, and previous support turned resistance. Breaking this changes the chart significantly. Above that, resistance sits around $105-$110 until the $125-$135 previous consolidation area.
Higher lows are beginning to appear, which is encouraging. But price has not yet produced a meaningful higher high. A bullish trend officially begins after a higher low is followed by a higher high and then another higher low. Right now we only have the first part.
| Indicator | Assessment |
|---|---|
| Long-term trend | Bearish |
| Medium-term trend | Neutral |
| Short-term momentum | Slightly improving |
| RSI | Neutral (44) |
| 200-day MA | Bearish (price below) |
| Support quality | Strong around $65-70 |
| Resistance | Heavy around $90-95 |
| Probability of base forming | Moderate to High |
Solana Price Predictions
Based on everything I analyzed today about Solana, here are my current price predictions:
Bullish Scenario
If SOL can reclaim $85 and then break $92-$95, I would expect momentum buyers to enter. Potential targets are $105, $120, $135, and $150. Above $150, the long-term bear trend would look much weaker.
Bearish Scenario
If price loses $70 and then $65, expect another wave lower. Possible downside includes $60, $55, and possibly the low $50s. That would invalidate much of the current basing structure.
Base Case (Most Likely)
Given the current chart, the highest-probability scenario is continued range trading between roughly $70 and $90 while the market waits for a catalyst. This kind of prolonged consolidation often precedes a larger move, but the direction is not confirmed until one side breaks.
Read more news: Solana Doubles Tokenized Stock Volume
Solana News Today
Asset manager Bitwise has filed with regulators for a Solana exchange-traded fund (ETF). This formal filing makes SOL the next major crypto asset, after Bitcoin and Ethereum, to enter the institutional ETF conversation. The move signals growing professional interest in Solana.
World.xyz, a prediction market that launched on Solana on July 1, posted it was migrating to the new Robinhood Chain after just one week. No confirmation exists from Robinhood, and the account has a history of meme-driven trolling. The community is skeptical, but the migration would be a significant blow to Solana’s prediction market ecosystem if true.
The CASHCAT memecoin skyrocketed over 1,100% on Robinhood Chain following an endorsement by the platform’s CEO. The surge briefly pushed its market cap past $150 million, demonstrating the chain’s rapid retail traction. This is a reminder that retail attention can move quickly to new platforms.
Subscribe to our YouTube channel for daily crypto updates, market insights, and expert analysis.
The post Solana Price Finally Flashes a Bullish Sign We’ve Been Waiting For! appeared first on CaptainAltcoin.


Ayrıca Şunları da Beğenebilirsiniz

Solana price confirms bearish crossover following Drift exploit, will it crash?

Ares Strategic Mining Establishes New Investor Relations Team Following $10 Million Funding

Tether Pushes $500B Valuation Deal With 14-Day Investor Deadline


Popüler Haberler
Daha fazla
