

Crypto Price Prediction for Today, July 9: Bitcoin (BTC), XRP, Hedera (HBAR)
Global markets entered another uncertain session after fresh geopolitical developments and mixed macroeconomic signals left investors searching for direction. Bitcoin, XRP, and Hedera have all reached important technical levels where a breakout or rejection could decide the next move.
Technical indicators offer useful clues, although each asset faces a different set of challenges before today’s trading session comes to a close.
Bitcoin Price Faces Key Resistance as Global Events Shape BTC Price
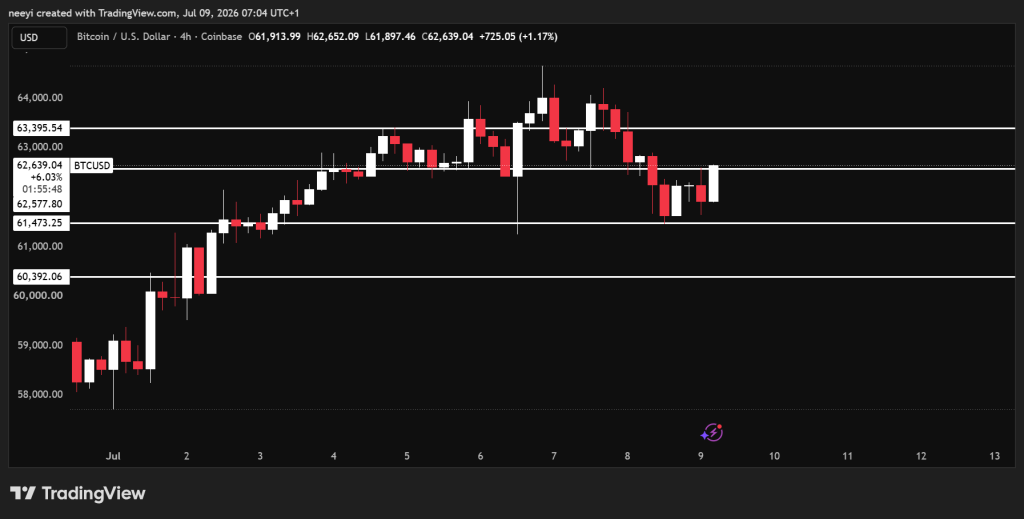
Bitcoin price has spent the last several 4 hour sessions moving inside a relatively tight range between $61,473 and $62,577. That range has become the market’s immediate battleground.
A move above $62,577 could open the door for Bitcoin to test around $63,395 during today’s session. Failure to defend support near $61,473 could send BTC price back toward the $60,390 region before buyers attempt another recovery.
Several major factors continue influencing Bitcoin today.
 BTC Price Chart / TradingView.com
Geopolitical Tensions Continue Affecting Bitcoin Price
Fresh geopolitical uncertainty has increased caution across financial markets.
The United States carried out airstrikes against Iranian targets after attacks on ships in the Strait of Hormuz. That development pushed investors toward safer assets and reduced demand for higher risk investments such as cryptocurrencies.
Higher crude oil prices have also increased inflation concerns. Those concerns have strengthened expectations that central banks may keep interest rates higher for longer, which usually limits liquidity flowing into assets like Bitcoin.
Federal Reserve Minutes Added Another Layer of Uncertainty
Market participants also examined the Federal Reserve’s June meeting minutes.
Earlier labor market data had increased expectations that interest rate cuts could arrive sooner than expected. Higher energy prices weakened that optimism and left markets trading inside narrow ranges as investors reassessed the outlook.
Institutional Demand Continues Supporting Bitcoin
Another important difference remains visible beneath the surface. Institutional demand has remained healthy despite weaker overall market sentiment. BlackRock’s IBIT ETF recorded more than $200 million in net inflows, which helped provide support for Bitcoin.
Retail spot demand remains less convincing. A negative Coinbase Premium continues showing that buying pressure from U.S. spot investors has stayed relatively weak.
Bitcoin Technical Indicators Paint A Mixed Picture
Current technical readings present a balanced picture instead of a clear trend. The Relative Strength Index sits at 48.711, which places Bitcoin in neutral territory. Buyers and sellers currently appear evenly matched.
The MACD has generated a buy signal with a reading of 149.6. That shows bullish momentum has started improving despite recent consolidation. The ADX stands at 33.952 and currently gives a sell signal. That suggests the existing trend still favors sellers despite recent recovery attempts.
Williams %R reads -4.173, placing Bitcoin in overbought territory. That often means buyers may slow unless fresh demand enters the market. The Commodity Channel Index stands at -71.3941. That reading also produces a sell signal and points to lingering weakness beneath recent price action.
| Indicator | Value | Action |
|---|---|---|
| RSI (14) | 48.711 | Neutral |
| MACD (12,26) | 149.6 | Buy |
| ADX (14) | 33.952 | Sell |
| Williams %R | -4.173 | Overbought |
| CCI (14) | -71.3941 | Sell |
Bitcoin Price Prediction for Today
Three outcomes remain possible during today’s session.
- Bullish scenario: Bitcoin breaks above $62,577 and extends toward approximately $63,395 if buying volume improves.
- Neutral scenario: BTC price continues trading between $61,473 and $62,577 as buyers and sellers remain balanced.
- Bearish scenario: Bitcoin loses support near $61,473. That move could push BTC price toward roughly $60,390 before fresh demand appears.
XRP Price Tests Resistance After Recent Recovery
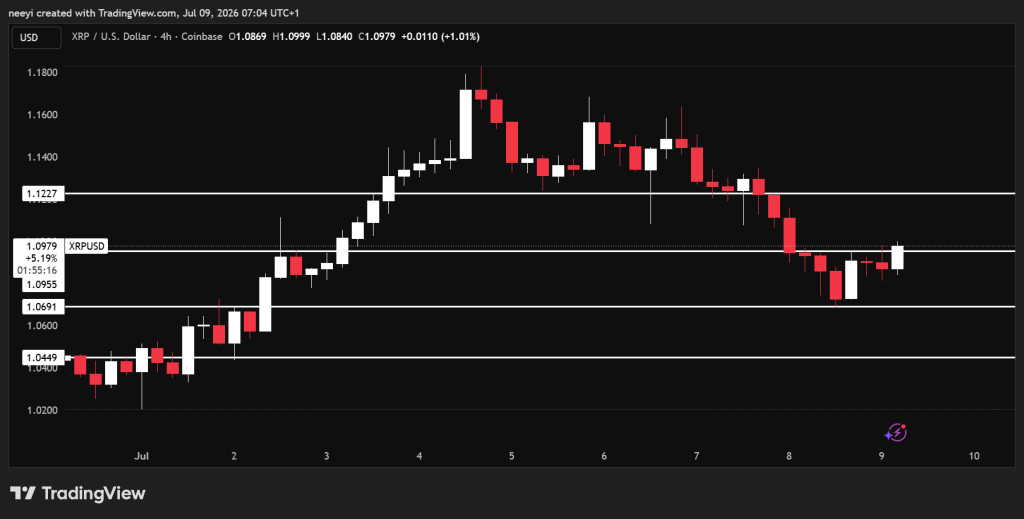
XRP price currently trades around $1.09 and sits very close to resistance near $1.095.
A successful breakout above that level could allow XRP to reach approximately $1.12 before today’s session ends.
Support remains around $1.069. Loss of that level could send XRP price toward $1.04 if sellers regain control.
 XRP Price Chart / TradingView.com
XRP Technical Indicators Continue Favoring Sellers
Current momentum indicators remain cautious.
The RSI stands at 44.868. That reading stays below the neutral 50 level and indicates sellers still hold a slight advantage. MACD prints -0.004, which keeps its sell signal intact and shows bullish momentum has not fully returned.
ADX stands at 40.097. That reading indicates a relatively strong trend, although current direction still favors sellers.
Williams %R reads -71.645. That keeps XRP inside bearish territory without reaching deeply oversold conditions. The CCI reading of -73.751 also produces another sell signal and supports the cautious outlook.
| Indicator | Value | Action |
|---|---|---|
| RSI (14) | 44.868 | Sell |
| MACD (12,26) | -0.004 | Sell |
| ADX (14) | 40.097 | Sell |
| Williams %R | -71.645 | Sell |
| CCI (14) | -73.751 | Sell |
XRP Price Prediction for Today
Several paths remain possible during today’s trading.
- Bullish scenario: XRP price breaks above $1.095 and climbs toward approximately $1.12.
- Neutral scenario: XRP remains between $1.069 and $1.095 as the market waits for a stronger catalyst.
- Bearish scenario: XRP falls below $1.069. That move could send XRP price toward about $1.04 before buyers attempt another defense.
Hedera Price Attempts To Confirm A Bullish Breakout
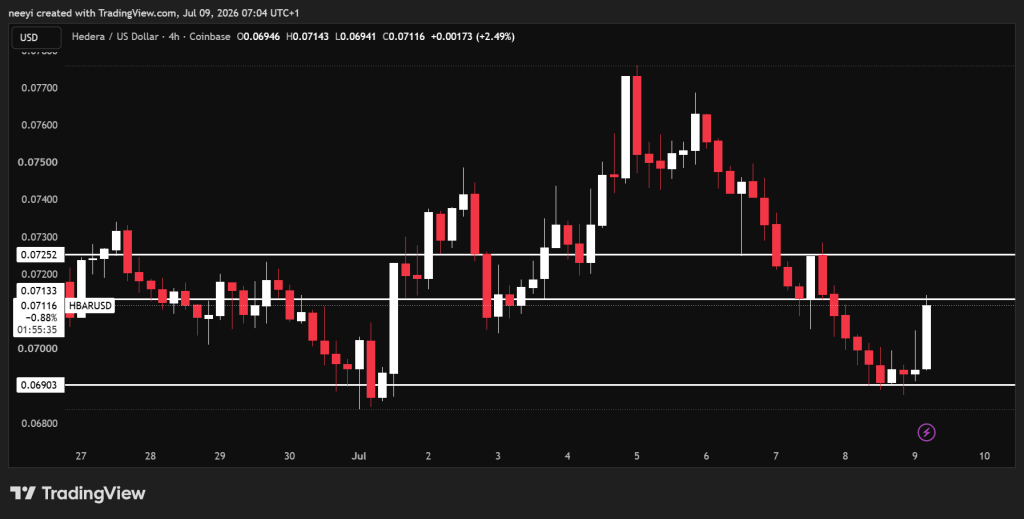
Hedera has recovered after falling close to $0.068 and now trades around $0.07. HBAR price is testing resistance near $0.0713 as buyers continue pushing higher on the current 5 hour structure from Investing.com.
A break above $0.0713 would confirm a short term break of structure. That move could open the path toward approximately $0.0725 later today.
Failure to break resistance could leave HBAR trading between $0.069 and $0.0713 through the remainder of the session.
Loss of support near $0.069 would strengthen the bearish case and expose lower price levels.
 HBAR Price Chart / TradingView.com
Hedera Technical Indicators Continue Showing Weak Momentum
Technical readings from the Investing.com 5-hour chart remain mostly bearish despite recent recovery.
The RSI stands at 44.303, which keeps HBAR below the neutral midpoint. MACD prints -0.001 and continues producing a sell signal despite improving price action.
ADX stands at 51.362, which indicates a strong trend. Current direction still favors sellers. Williams %R comes in at -69.919, placing Hedera inside bearish territory. CCI reads -57.64 and also maintains a sell signal.
| Indicator | Value | Action |
|---|---|---|
| RSI (14) | 44.303 | Sell |
| MACD (12,26) | -0.001 | Sell |
| ADX (14) | 51.362 | Sell |
| Williams %R | -69.919 | Sell |
| CCI (14) | -57.64 | Sell |
Hedera Price Prediction for Today
HBAR price has several possible outcomes before today’s session closes.
- Bullish scenario: Hedera breaks above $0.0713 and extends toward approximately $0.0725 after confirming the breakout.
- Neutral scenario: HBAR price remains inside the $0.069 to $0.0713 range as buyers and sellers continue competing for control.
- Bearish scenario: Hedera falls below $0.069. That move could expose lower support levels during today’s trading.
FAQs
Subscribe to our YouTube channel for daily crypto updates, market insights, and expert analysis.
The post Crypto Price Prediction for Today, July 9: Bitcoin (BTC), XRP, Hedera (HBAR) appeared first on CaptainAltcoin.


Ayrıca Şunları da Beğenebilirsiniz

Sony Ventures into US Stablecoin Market with New Trust Entity

Japonya Merkezli Sony Bank, ABD’de Dolar Destekli Stablecoin İhraç Etmeye Hazırlanıyor! İşte Detaylar

SpaceXAI Enters The AI Race With New Coding Model


Popüler Haberler
Daha fazla
