

Bitcoin Price Crashes Under $90K, Triggering Fresh Fears of Deeper Weakness
Bitcoin price started another decline below $90,000. BTC is now showing bearish signs and might struggle to recover above $88,5000.
- Bitcoin started a fresh decline below $92,000 and $90,000.
- The price is trading below $90,000 and the 100 hourly Simple moving average.
- There is a bearish trend line forming with resistance at $91,000 on the hourly chart of the BTC/USD pair (data feed from Kraken).
- The pair might continue to move down if it settles below the $90,000 zone.
Bitcoin Price Dips Further
Bitcoin price failed to stay in a positive zone above the $90,000 level. BTC bears remained active below $88,800 and pushed the price lower.
The bears gained strength and were able to push the price below the $87,500 zone. A low was formed at $85,276, and the price is now consolidating losses below the 23.6% Fib retracement level of the recent decline from the $92,872 swing high to the $85,276 low.
Bitcoin is now trading below $90,000 and the 100 hourly Simple moving average. Besides, there is a bearish trend line forming with resistance at $91,500 on the hourly chart of the BTC/USD pair.
If the bulls attempt another recovery wave, the price could face resistance near the $87,000 level. The first key resistance is near the $89,000 level and the 50% Fib retracement level of the recent decline from the $92,872 swing high to the $85,276 low.
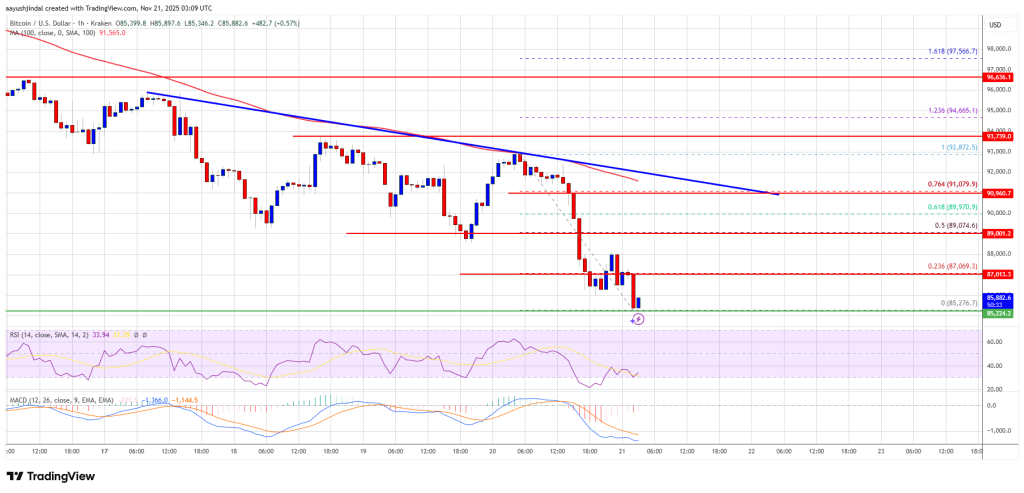
The next resistance could be $91,000 and the trend line. A close above the $91,000 resistance might send the price further higher. In the stated case, the price could rise and test the $92,500 resistance. Any more gains might send the price toward the $93,200 level. The next barrier for the bulls could be $94,500 and $95,000.
More Losses In BTC?
If Bitcoin fails to rise above the $90,000 resistance zone, it could start another decline. Immediate support is near the $85,500 level. The first major support is near the $85,000 level.
The next support is now near the $83,200 zone. Any more losses might send the price toward the $82,500 support in the near term. The main support sits at $80,000, below which BTC might accelerate lower in the near term.
Technical indicators:
Hourly MACD – The MACD is now gaining pace in the bearish zone.
Hourly RSI (Relative Strength Index) – The RSI for BTC/USD is now below the 50 level.
Major Support Levels – $85,500, followed by $85,000.
Major Resistance Levels – $87,000 and $89,000.


Ayrıca Şunları da Beğenebilirsiniz

Pi Network Hits Over 526 Million Validations as User Base Continues To Grow

Pi Network Hits 526M KYC Milestone, Users Rise


