

CoinMarketCap sentiment rocket post coincides with sharp crypto market reversal
At a moment of whiplash in digital asset markets, shifting coinmarketcap sentiment became a focal point for traders watching a possible macro-driven rebound.
Rocket post at peak fear
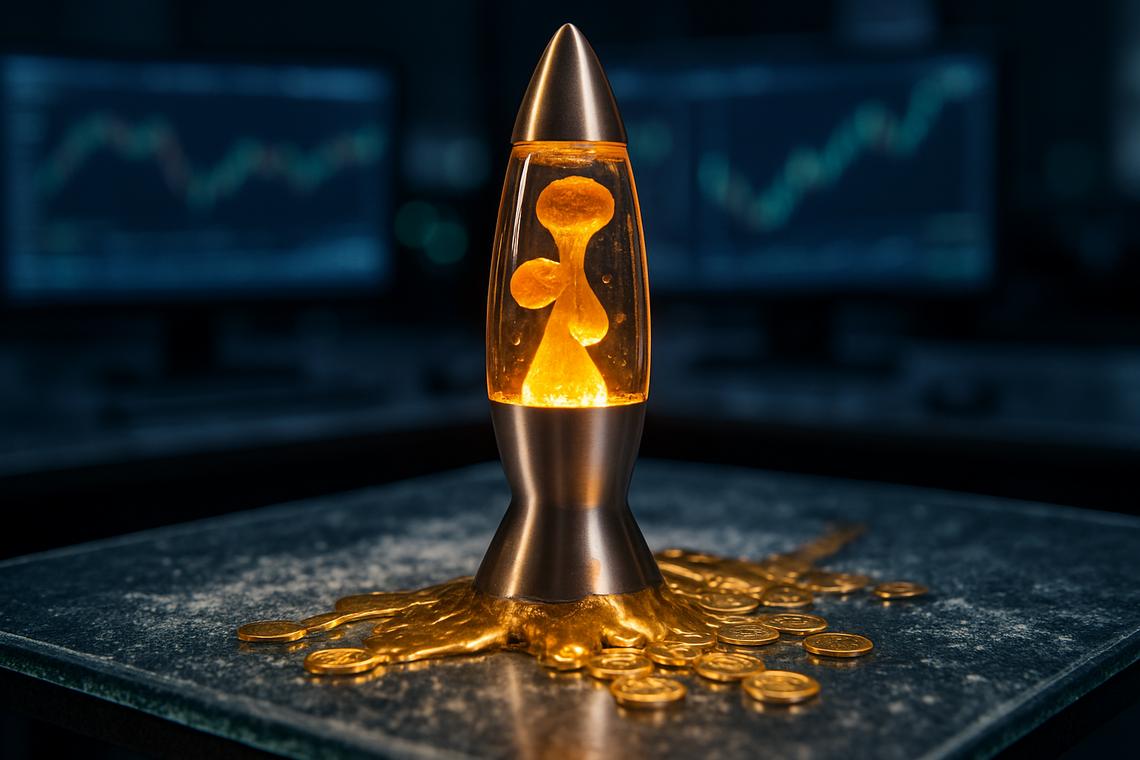
On March 24 at 4:00 PM UTC, CoinMarketCap shared a wordless but bullish signal: a single rocket emoji and an AI-generated image of a metallic, rocket-shaped lava lamp. The post appeared just as crypto markets were attempting to recover from some of their deepest fear readings in years.
The timing proved striking. Just one day earlier, CoinMarketCap’s own Crypto Fear & Greed Index had dropped to 8 out of 100, firmly in “extreme fear” territory, as traders dumped XRP, Solana, and DeFi positions. Moreover, this capitulation came amid intensifying geopolitical worries and macroeconomic pressure.
The rocket post quickly gained traction. It drew 34,500 views, 598 likes, and 75 retweets, making it one of the most-engaged items in crypto’s trending feed that day. However, CoinMarketCap offered no text caption, leaving the community to interpret the minimalistic signal on its own.
Extreme fear readings and market backdrop
The broader context underscored how fragile confidence had become. Despite the heavy selling in major altcoins, total crypto market capitalization held near $2.36 trillion, according to CoinMarketCap data, while investors rotated defensively into cash and stablecoins. That said, the mood remained deeply risk-off.
The fear had not emerged overnight. In February, the same sentiment gauge plunged to a yearly low of 5 on Feb. 6, a level last seen in the depths of 2022, as the global crypto market cap shed roughly $2 trillion from its 2025 peak. By mid-March, sentiment had clawed its way back toward neutral before another wave of geopolitical anxiety knocked it lower again.
The latest downdraft was linked to rising tensions around Iran. Investors fretted that further escalation could pressure risk assets, especially cryptocurrencies that had rallied sharply earlier in the cycle. Moreover, the renewed uncertainty helped drag the index back toward single-digit readings, emphasizing just how quickly optimism can fade.
Macro catalyst and Bitcoin’s rebound
The apparent catalyst for the sentiment reversal came from geopolitics rather than on-chain developments. On March 24, U.S. President Donald Trump signaled a pause in military escalations against Iran, suggesting a potential opening for diplomatic talks. This shift triggered an almost immediate risk-on move across global markets.
Bitcoin, which had recently fallen to approximately $67,000, rallied nearly 4% to break above $71,000. According to Fortune, the push higher lifted bitcoin‘s market capitalization back toward $1.33 trillion, underlining how quickly capital can return once macro fears ease even slightly.
At the same time, the wider crypto market cap climbed to around $2.44 trillion, based on CoinMarketCap figures, with BTC dominance staying elevated at close to 58%. Moreover, the move marked a stark contrast with the panic-driven selling that had dominated just a day earlier, reinforcing the sense of a potential market sentiment reversal.
CoinMarketCap sentiment signal and community reaction
It was precisely at this inflection point that CoinMarketCap posted its rocket image, prompting many to read it as an understated confidence signal. The platform describes itself as “the Home Of Crypto” and promotes its sentiment gauge as “the most trusted” in mainstream financial media. In this context, even a single emoji carried symbolic weight.
The community’s response reflected that interpretation. One user replied “Comfy in spot,” apparently expressing comfort with spot crypto exposure even after recent volatility. Another commented, “It’s mesmerizing, I could watch it all day,” referring to the lava lamp imagery. However, the lack of explicit commentary from CoinMarketCap allowed the post to function more as a mood indicator than a direct call.
The episode also highlighted how social sentiment signals can amplify or crystallize themes already forming in price action and macro headlines. While metrics like trading volume and volatility remain core inputs for professional investors, brief visual posts from influential platforms can still frame how retail traders understand shifting conditions.
Inside the CoinMarketCap Fear & Greed Index
CoinMarketCap’s Fear & Greed Index, often compared with broader fear and greed index crypto measures, operates on a 0–100 scale. It combines five data pillars: price momentum across the top 10 non-stablecoin assets, volatility readings for Bitcoin and Ethereum, options put/call ratios, stablecoin supply ratios, and CoinMarketCap’s proprietary social data.
According to the platform, “extreme fear likely indicates undervalued asset prices.” By its own methodology, markets had spent weeks inside that “extreme fear” band before the late-March bounce. Moreover, the swift transition from a reading of 8 to a resurgent bitcoin price illustrated how quickly those conditions can begin to unwind once selling pressure abates.
Many analysts therefore watched the late-March move as a potential template for how geopolitics can abruptly invert perceived risk in crypto. However, whether the combination of macro relief and a prominent sentiment signal proves durable, or merely a fleeting head fake, will only become clear with more data.
Sentiment artifact at a turning point
For now, the March 24 rocket post stands as a snapshot of a market in flux. After months dominated by fear, the publisher of the data itself appeared willing to hint at renewed optimism, even if only through an image and an emoji.
In that sense, the moment encapsulated how intertwined macro news, price action, and social media have become in modern crypto markets. CoinMarketCap’s wordless signal did not cause the rebound, but it captured the mood precisely as traders weighed whether the latest upswing marked the start of a sustained recovery.


Ayrıca Şunları da Beğenebilirsiniz

TOKEN2049 Dubai postponed: Why Paris matters next

BitMine’s $11B Ethereum Bet — Smart Move or Risky Gamble Before the Next Bull Run?


