

Dogecoin (DOGE) Price Analysis: Bollinger Band Compression Signals Imminent Breakout
Key Takeaways
- DOGE price action remains constrained under the declining 50-day EMA near $0.0900
- Futures market data reveals negative funding rates and higher short position concentration
- Critical support level at $0.0879 must hold — breakdown risks pushing price toward $0.0800
- Upside breakout requires clearing $0.0930 barrier to unlock path toward $0.10
- Daily chart Bollinger Band compression indicates significant volatility approaching
Dogecoin currently trades around $0.0926, registering a 2.28% gain over the last 24 hours, though resistance near $0.0930 continues to cap upward momentum. The popular meme cryptocurrency finds itself trapped between tentative bullish attempts and ongoing downward pressure, creating a tight consolidation zone that has traders on high alert.
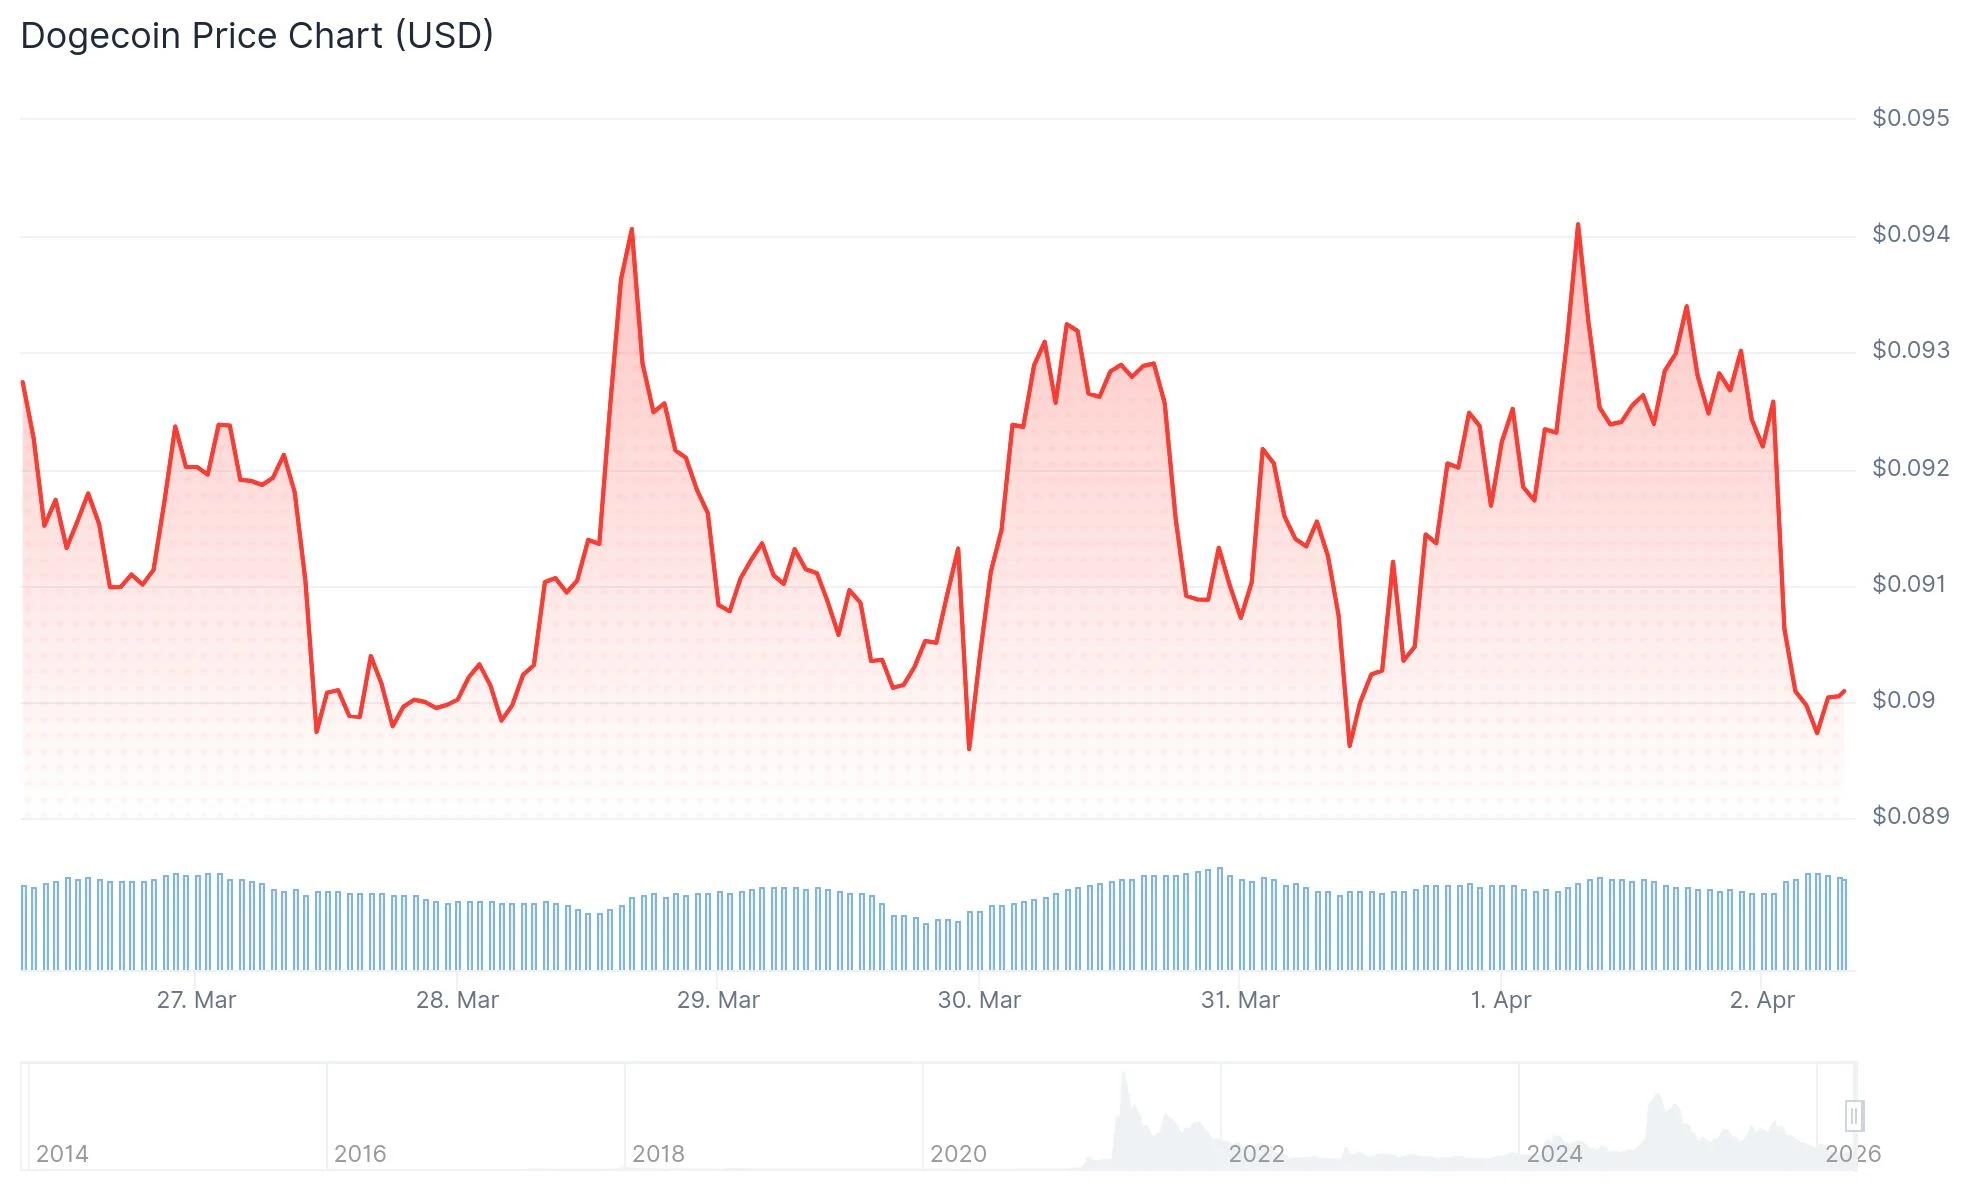 Dogecoin (DOGE) Price
The token touched intraday lows at $0.0890 before buyers emerged to defend that level. Following the bounce, DOGE advanced through $0.0905, $0.0912, and $0.0920 in consecutive stages. This rally carried price above the 50% Fibonacci retracement of the recent decline from $0.0937 down to $0.0893.
Hourly chart analysis reveals a developing bearish trend line with resistance concentrated around $0.0928. The 76.4% Fibonacci level converges near this identical zone, creating a formidable technical obstacle. Sellers have successfully protected this ceiling multiple times.
Price action maintains a position above both $0.0912 and the 100-hour simple moving average. While this technical positioning suggests a mildly constructive short-term outlook, the margin remains narrow and vulnerable to reversal.
Futures Market Signals Bearish Positioning
Derivatives metrics for Dogecoin indicate prevailing negative sentiment. Data from CoinGlass shows DOGE futures Open Interest currently at $1.05 billion, representing a 0.81% decline over 24 hours. Liquidation events totaled $4.55 million during this timeframe, with long positions accounting for $3.48 million of that figure.
The long-to-short ratio for active DOGE contracts stands at 0.967, indicating short positions outnumber longs among active traders. Funding rates have fallen into negative territory at -0.0097%, demonstrating that short sellers are paying to maintain their bearish bets.
Market analyst Ali Charts highlighted on X that Bollinger Bands are experiencing compression on Dogecoin’s daily timeframe. The analyst indicated this technical setup typically precedes substantial price movement, although the directional bias remains uncertain.
Critical Price Zones Under Scrutiny
For bulls to gain control, DOGE must decisively breach the $0.0928–$0.0930 resistance cluster to establish a pathway toward $0.0950, followed by $0.0980. Successfully clearing $0.0980 would place the psychologically significant $0.10 mark within reach, with $0.1020 representing the subsequent upside objective.
The 50-day exponential moving average at $0.0974 and 100-day EMA at $0.1107 present additional overhead resistance barriers.
Regarding downside risk, immediate support emerges at $0.0915. Breaking beneath that level brings $0.0900 into play as a crucial psychological threshold. Should DOGE close below $0.0879 on a daily basis—matching the February 11 low—the door opens for further decline toward $0.0800, with $0.0741 as an extended target.
The hourly Relative Strength Index maintains positioning above the 50 neutral level, while the MACD indicator remains in positive territory despite showing signs of weakening momentum. On the daily timeframe, RSI readings hover near 43, positioned below the midpoint and reflecting modest bearish undertones.
Current market structure shows DOGE maintaining its position above near-term support at $0.0912, while the $0.0930 resistance zone stands as the primary challenge bulls must overcome in the upcoming trading sessions.
The post Dogecoin (DOGE) Price Analysis: Bollinger Band Compression Signals Imminent Breakout appeared first on Blockonomi.


Ayrıca Şunları da Beğenebilirsiniz

TOKEN2049 Dubai postponed: Why Paris matters next

BitMine’s $11B Ethereum Bet — Smart Move or Risky Gamble Before the Next Bull Run?


