MEXC News is a trusted source for crypto industry updates in Philippines and worldwide. Discover coverage spanning Bitcoin, Ethereum, blockchain, and Web3, while staying on top of key factors driving the markets.MEXC News is a trusted source for crypto industry updates in Philippines and worldwide. Discover coverage spanning Bitcoin, Ethereum, blockchain, and Web3, while staying on top of key factors driving the markets.
2026-06-24 Wednesday
Crypto News in Philippines
Explore the hottest crypto news and market updates tailored for Philippines
Brent crude under US$75 for first time since start of Middle East war
LONDON, June 24 — The price of Brent North Sea crude, the international benchmark, extended losses today to trade...
Share
Author: Malaymail2026/06/24 20:30

Strategy May Need to Pause Bitcoin Purchases, CryptoQuant Warns
Strategy’s dividend coverage dropped from over seven years to only 14 months. CryptoQuant says rebuilding cash reserves may outweigh further Bitcoin purchases.
Share
Author: LiveBitcoinNews2026/06/24 20:30
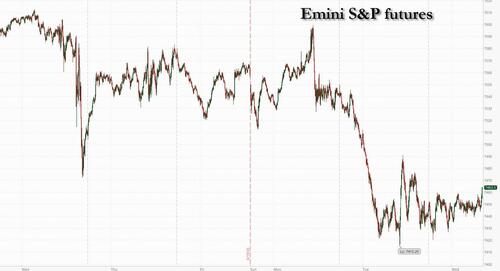
Futures Rebound From "Chip-Wreck" Ahead Of Critical Micron Earnings
Futures Rebound From "Chip-Wreck" Ahead Of Critical Micron Earnings US stocks are set for a rebound with equity futures higher as Semis and Tech stage
Share
Author: ZeroHedge2026/06/24 20:25

Ex-Trump lawyer panics when confronted on Epstein ties: 'Let me get a pic so I can sue!'
Alan Dershowitz, who previously served as President Donald Trump’s lawyer during his first impeachment trial, appeared to be captured on video in New York City
Share
Author: Rawstory2026/06/24 20:09

IFX Launches the First Market for AI Token Futures
IFX, the Intelligence Futures Exchange, today announced the launch of its OTC request market for cash-settled AI token futures. The market gives AI companies, API
Share
Author: Captainaltcoin2026/06/24 20:07

Qualcomm eyes ByteDance deal in bid to rival Nvidia
Qualcomm is reportedly in talks with ByteDance to design customized chips for the TikTok parent company. The negotiations show yet another front in the race by
Share
Author: Cryptopolitan2026/06/24 19:49

Binance Says It Will Remain in Europe Despite Greek Licensing Setback
The post Binance Says It Will Remain in Europe Despite Greek Licensing Setback appeared first on Coinpedia Fintech News Binance has said it is not leaving Europe
Share
Author: CoinPedia2026/06/24 19:46

Bee Network Update: $BEE Migrates to Bee Honey Ahead Launch
Bee Network Update: $BEE Coin Balances Safe During Bee Honey MigrationBee Network just rolled out a new version update, and $BEE Coin now carries a new name: Bee
Share
Author: Coingabbar2026/06/24 19:45