Microsoft Stock loses short-term momentum as key support holds

Microsoft Stock remains broadly stable on the daily chart, but short-term momentum has softened. The bias is still neutral to slightly constructive rather than outright bullish, as MSFT holds above near-term averages but remains below its 200-day trend marker.
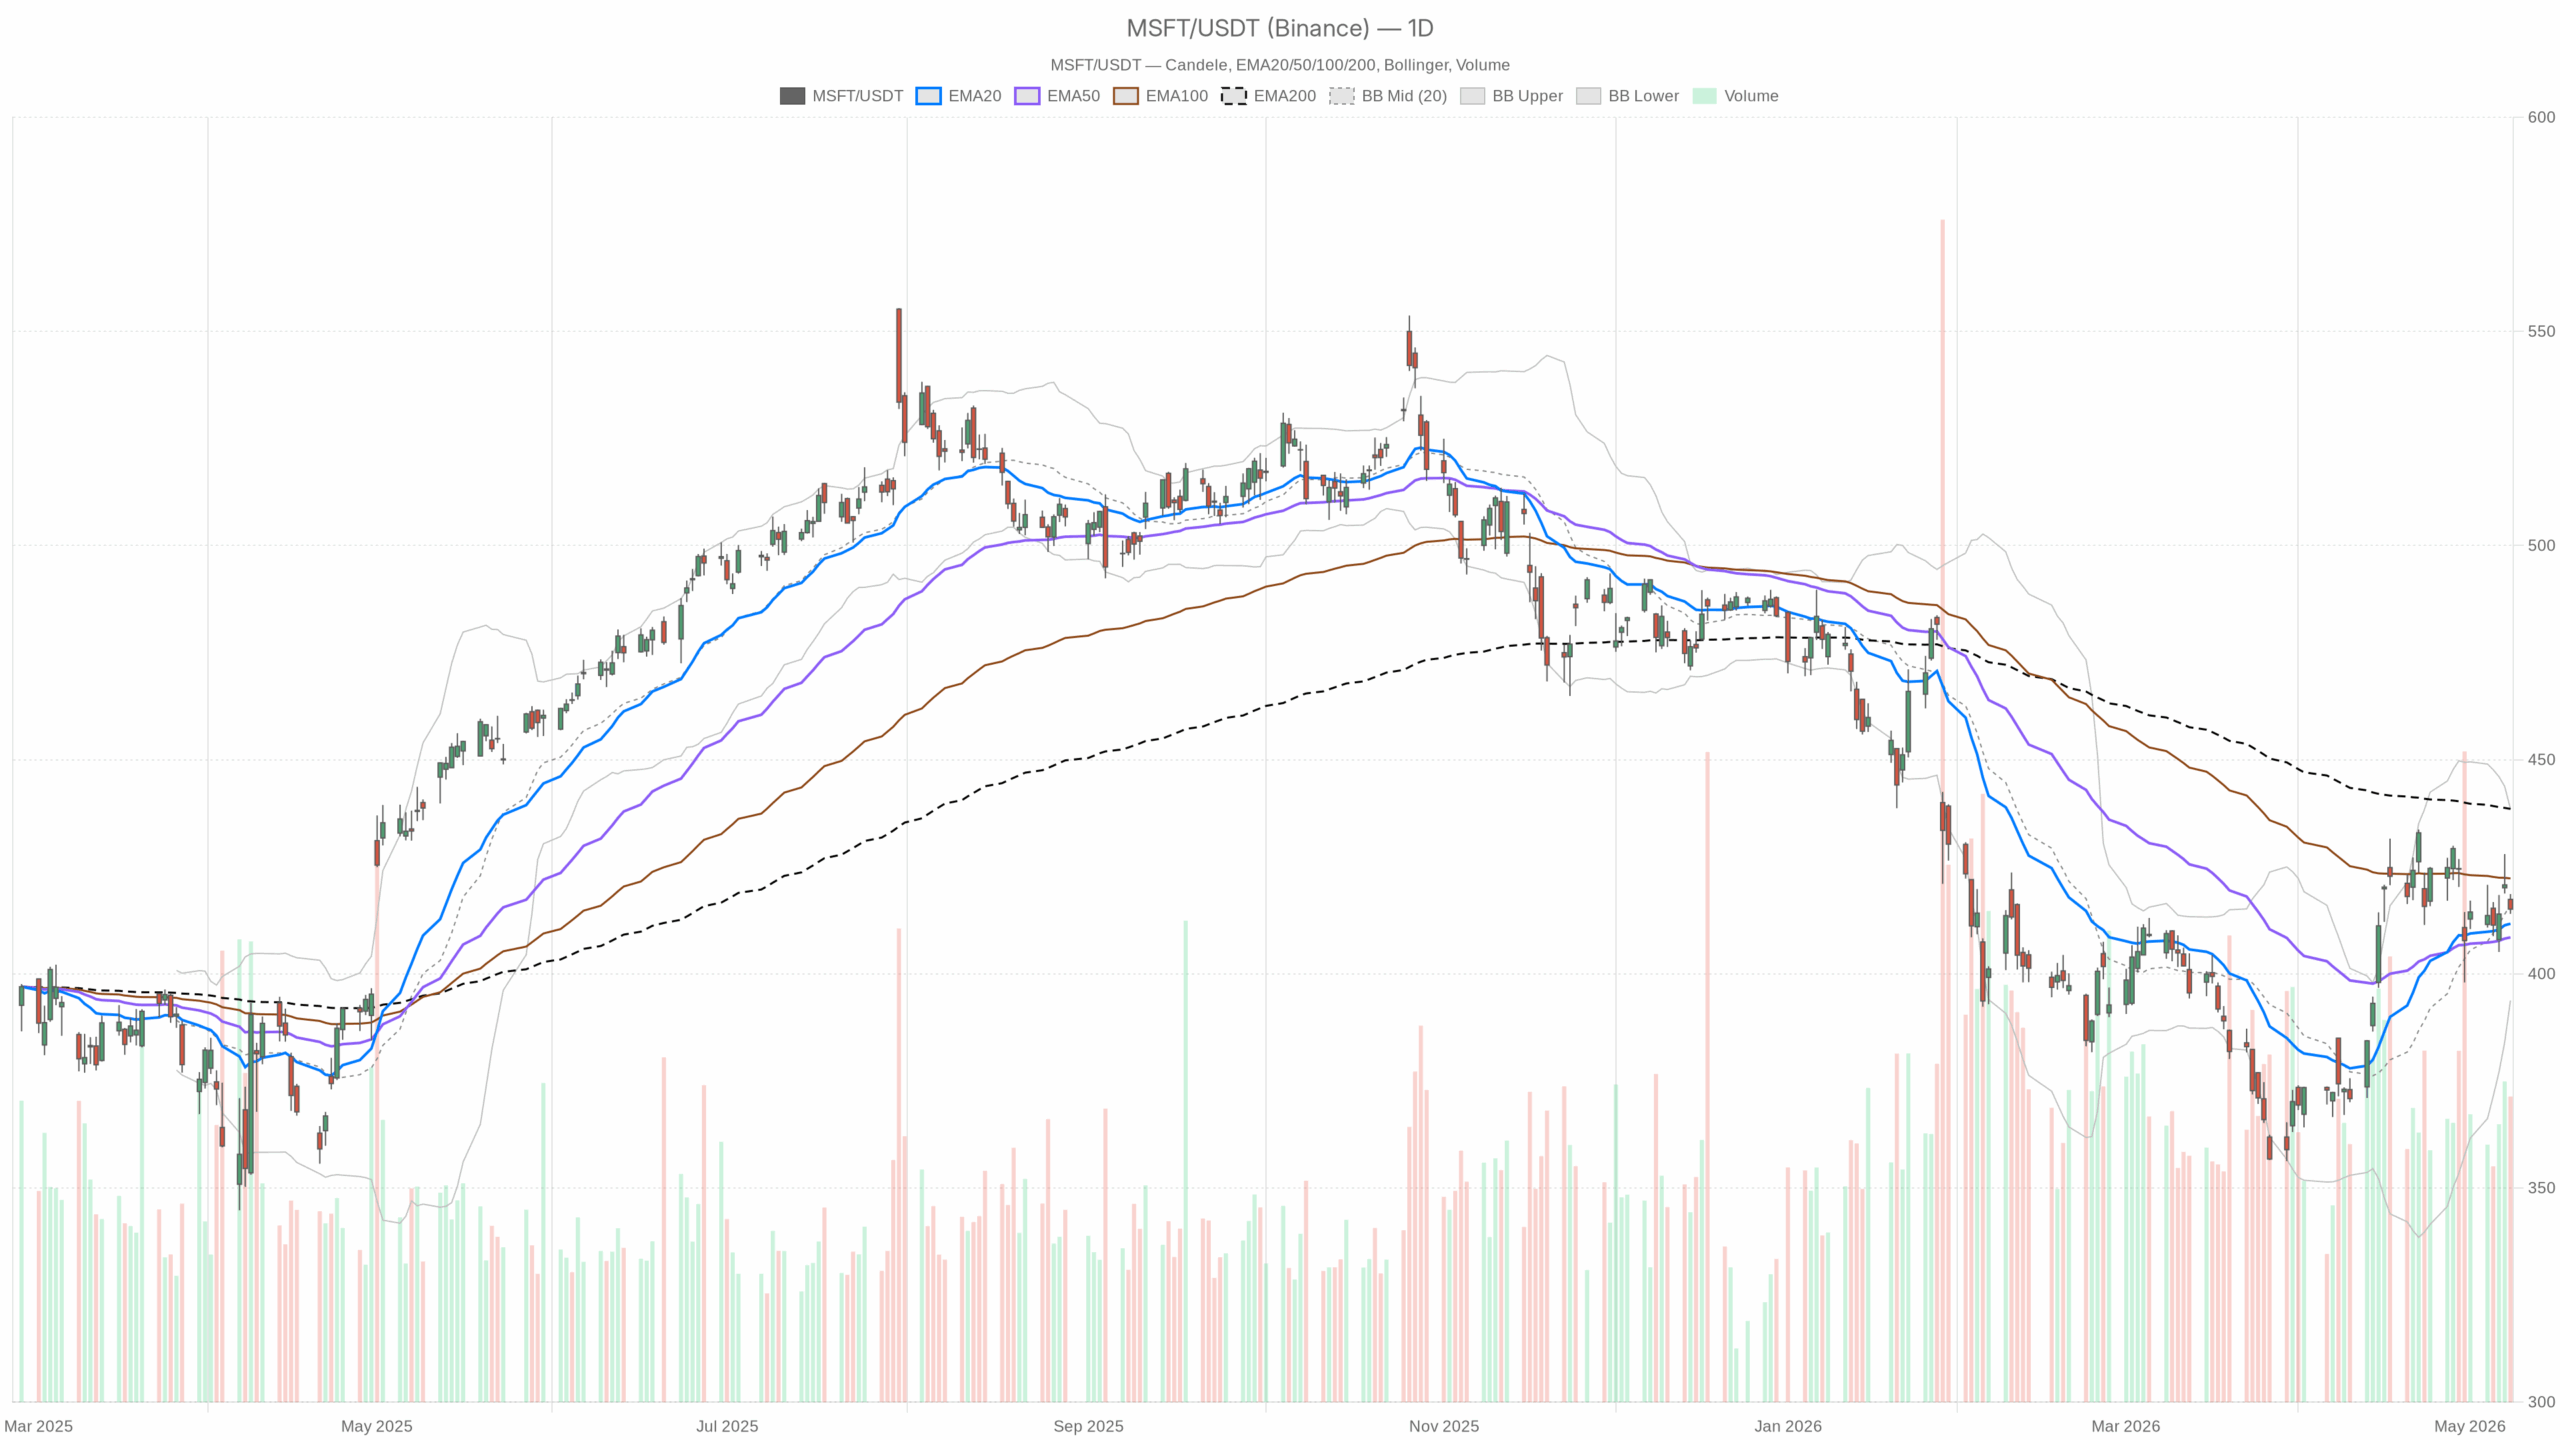 MSFT — daily chart with candlesticks, EMA20/EMA50 and volume.
Microsoft Stock Daily Chart Signals a Stable but Incomplete Recovery
On the daily timeframe, Microsoft closed at 415.12, almost exactly on the daily pivot point at 415.92 and close to the Bollinger mid-band at 416.14. That positioning matters. It shows a stock trading near equilibrium rather than in a directional expansion.
The daily regime is also marked as neutral, which fits a market that is neither breaking down nor showing enough strength to reassert a full upside trend. Overall, the setup remains mildly supportive, but not decisive.
Trend Structure and Moving Averages
The 20-day EMA stands at 411.71 and the 50-day EMA at 408.51, both below spot. That tells us near-term trend support is still intact. However, the 200-day EMA sits much higher at 438.51, which keeps the broader recovery effort incomplete.
In practical terms, Microsoft has improved from its lower levels, but it has not yet rebuilt a long-term uptrend. Therefore, the daily chart supports patience more than conviction.
Momentum and Volatility Context
Daily momentum is steady but not strong. RSI is 53.89, which points to balanced momentum with a slight positive lean rather than overbought strength.
Meanwhile, MACD remains positive on the line at 5.88, but it sits below the signal line at 6.96 and the histogram is negative at -1.08. That combination usually points to fading upside momentum, even if the broader structure has not turned bearish.
Volatility also supports a measured view. The Bollinger Bands run from 393.82 to 438.47, with price near the middle rather than pressing an outer band. ATR at 11.83 shows the stock still has room for meaningful daily swings. Still, neutrality here does not mean inactivity. It means direction has not been resolved.
Microsoft Stock Key Daily Levels to Watch
The key daily levels are tight and important. Pivot support sits at 413.20, while resistance is at 417.83. With the latest close lodged between those markers, Microsoft Stock is effectively waiting for a catalyst.
A push above 417.83 would improve the near-term tone and open the door to a test of higher resistance areas. In contrast, a break below 413.20 would weaken the current holding pattern and shift attention back toward the lower end of the recent range.
Hourly Microsoft Stock Analysis Shows Softer Momentum
However, the 1-hour chart weakens the daily bias rather than confirming it. Microsoft closed at 415.15 on the hourly view, below the 20-hour EMA at 416.97 and the 50-hour EMA at 416.57, though still above the 200-hour EMA at 408.16.
That tells us the broader rebound structure has not fully broken, but the immediate intraday trend has rolled over. As a result, the short-term tone is softer than the daily chart implies.
Hourly Momentum and Volatility
Hourly momentum reinforces that softer tone. RSI is 46.39, which leans slightly negative and shows that buyers are not in control in the near term.
MACD on the 1-hour chart is marginally positive at 0.2, but it remains below the signal line at 0.85 and the histogram is negative at -0.65. That is not aggressive selling pressure. However, it does indicate weakening momentum and a market struggling to build follow-through on the upside.
Notably, the hourly Bollinger mid-band is 417.72, above current price, while the full range spans 409.55 to 425.88. Microsoft is trading under the center of that short-term volatility envelope, which usually reflects a market drifting below fair value for the session rather than pressing into breakout mode.
ATR at 3.78 points to enough intraday movement for sharp short-term swings, but not to a disorderly tape. Therefore, weakness is visible, though it is not yet extreme.
Hourly Pivot Structure
The hourly pivot structure is especially useful here. Price is sitting near the hourly pivot at 415.03, with resistance at 416.07 and support at 414.12. In other words, Microsoft is balanced at the very short-term decision zone.
A sustained move above 416.07 would begin to repair the hourly damage. Conversely, losing 414.12 would confirm that sellers still control the near-term tape.
15-Minute Chart Keeps the Immediate Execution Tone Soft
The 15-minute chart should be treated only as execution context, and it remains soft. Price at 415.15 is below the 20-period EMA at 416.00, below the 50-period EMA at 417.07, and below the 200-period EMA at 416.54. That shows weak short-term positioning.
RSI at 41.65 also leans negative. At the same time, the 15-minute MACD histogram is barely positive at 0.02 while the MACD line and signal line are almost equal. That hints at stabilization rather than a clear reversal.
Short-term volatility is compressed. Bollinger Bands run from 414.25 to 417.50, and price is hovering near the lower half of that range. ATR is only 0.93, so the immediate move is relatively contained.
The 15-minute pivot at 415.11 is almost exactly where the stock closed, with resistance at 415.99 and support at 414.28. That reinforces the idea that execution risk is concentrated around a very narrow intraday band.
Cross-Timeframe Conflict Limits Conviction in Microsoft Stock
There is a clear cross-timeframe conflict. The daily chart says Microsoft is still holding a constructive base above short-term support. However, the hourly and 15-minute charts show fading momentum and weaker price placement under key moving averages.
Therefore, the larger setup has not broken down, but the shorter timeframes are not yet validating an immediate upside continuation. That tension is the main reason the current bias stays neutral to slightly constructive rather than bullish.
Fundamental Backdrop Remains Supportive, but Price Action Leads
From a fundamental headline perspective, the recent news flow remains generally supportive. Coverage around AI monetization, infrastructure hiring, AI safety partnerships, and continued discussion of Microsoft’s strategic assets such as GitHub all reinforce the long-term growth narrative.
Still, none of these headlines appear to have triggered a decisive technical breakout in the current setup. For now, price action is more important than sentiment-heavy commentary.
Microsoft Stock Bullish and Bearish Scenarios
Bullish Scenario
The bullish scenario is straightforward. Microsoft Stock would need to hold above the 413.20 daily support area and reclaim the 417.83 daily resistance zone with improving hourly momentum.
Ideally, that would come with hourly price moving back above the 20-hour and 50-hour EMAs, while RSI pushes back above 50 and MACD turns more constructive. If that happens, the current neutral base could start evolving into a stronger recovery phase.
Bearish Scenario
On the other hand, the bearish scenario would build if the stock continues to fail near pivot resistance and slips under 413.20 on the daily structure. That would align the weaker hourly trend with a fresh daily deterioration.
If short-term support at 414.12 and then 414.28 gives way decisively, the market would likely treat the recent stabilization as a pause within a broader unresolved range rather than the start of a durable advance.
Microsoft Stock Outlook
Overall, Microsoft Stock is in a balanced but fragile position. The daily chart prevents a bearish call, yet the shorter timeframes do not justify a clean bullish one.
Positioning remains sensitive to relatively tight levels, and volatility is present without becoming extreme. Until price breaks clearly above resistance or loses support, the stock looks more like a range-bound market with a slight constructive undertone than a trend in full control.


You May Also Like

SHIB and Pi Move Sideways, BlockDAG Takes the Market Lead With a Live Casino and Utility Stack! Is It the Best Crypto to Buy Now?

Sui (SUI) Jumps 50% on Staking Surge and Stablecoin Plans