

ONDO Price Crashes 88% From All-Time Highs, But Analyst Says ‘Last Hope’ Zone Is Here
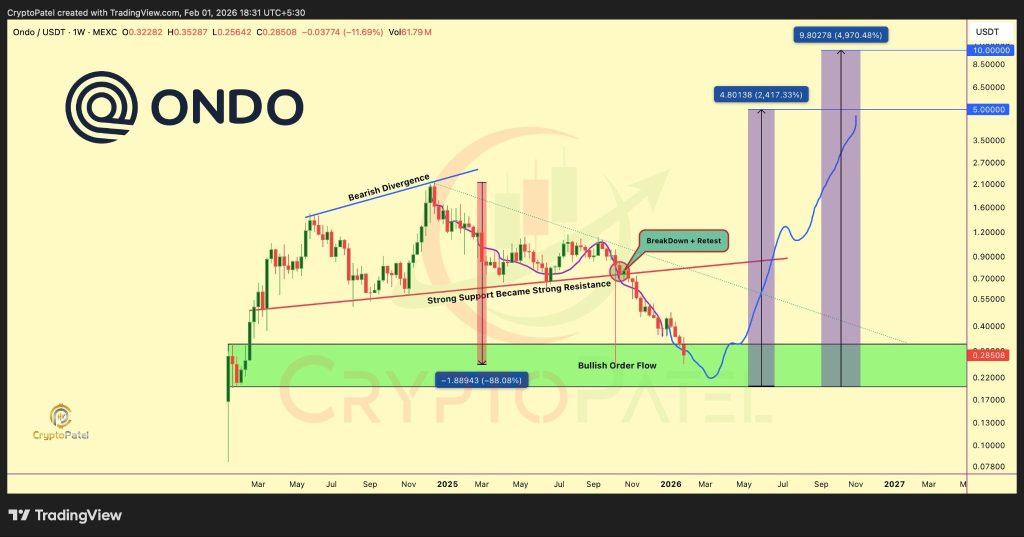
The ONDO price has drifted into a part of the chart that usually gets traders paying attention. After months of downside, the price is now sitting inside a zone that has mattered in the past. This isn’t a quick dip on a short timeframe. It’s a long-term area where the market tends to make real decisions.
Crypto Patel sums it up in a pretty direct way. This level is either where ONDO finds its footing and starts rebuilding, or where the structure finally gives way. There’s not much room left for indecision.
How ONDO Ended Up Here
If you zoom out, the story becomes clearer. The ONDO price peaked near $2.14 after momentum started weakening.
Bearish divergence showed up before the top, which usually hints that buyers are losing control. Once the trend broke, the price didn’t grind lower. It slipped through key levels and entered a deep correction.
One of the most important moments came when ONDO lost the $0.73–$0.80 area. That zone had been holding the price up during the prior move. When it broke and then failed to flip back into support, the tone changed. Every bounce into that area started getting sold.
From there, the ONDO price kept working lower until it reached the current range between roughly $0.32 and $0.20.
Why This ONDO Level Is Getting So Much Attention
This lower zone isn’t just a random support box. It lines up with a higher-timeframe demand area where buyers stepped in aggressively previously. On Crypto Patel’s chart, it also overlaps with bullish order flow, which is where selling pressure slowed and reactions became sharper.
 Source: X/@CryptoPatel
At this point, ONDO is down close to 88% from its high. Moves like that tend to clear out most short-term speculation. When price gets this stretched, sellers often lose urgency, even if the chart still looks weak. That’s usually when the groundwork for a base starts forming.
As long as the ONDO price holds above $0.20 on a weekly close, the bigger structure is still technically intact.
Read Also: Shiba Inu Price Prediction: How High Can SHIB Go by the End of 2026?
What a Recovery Might Look Like
If this demand zone holds, the first upside tests would likely target the $0.70 and $1.00 areas. Those levels line up with prior reactions and old structure. Clearing them wouldn’t erase the downtrend overnight, but it would show that accumulation is turning into real buying.
Looking further out, Crypto Patel points to $2 and even the $5–$10 range as possible expansion zones if supply unlocks are absorbed and the RWA narrative finds its footing through 2026. Those levels assume patience and confirmation, not a straight-line move.
The Level That Changes Everything
For all the upside talk, the downside line is simple. A sustained weekly close below $0.20 would weaken the entire demand thesis. In that case, the ONDO price would likely need more time before any serious recovery attempt.
For now, ONDO is sitting right where markets tend to go quiet. These are the zones where price either rolls over completely or starts laying the foundation for something much bigger.
Subscribe to our YouTube channel for daily crypto updates, market insights, and expert analysis.
The post ONDO Price Crashes 88% From All-Time Highs, But Analyst Says ‘Last Hope’ Zone Is Here appeared first on CaptainAltcoin.
You May Also Like

XRP Price Shows Best Risk/Reward Ratio, According to Scott Melker

Justin Bieber’s First No. 1 Single Turns 10
