Shiba Inu is doing that thing again where it quietly grinds higher while nobody’s watching. World Of Charts just pointed out that SHIB is retesting a key level,Shiba Inu is doing that thing again where it quietly grinds higher while nobody’s watching. World Of Charts just pointed out that SHIB is retesting a key level,

Is Shiba Inu (SHIB) About to Break Its Months-Long Downtrend? The Chart Shows What’s Next

2026/03/24 06:30
3 min read
For feedback or concerns regarding this content, please contact us at [email protected]

Shiba Inu is doing that thing again where it quietly grinds higher while nobody’s watching. World Of Charts just pointed out that SHIB is retesting a key level, and he’s expecting a move toward the descending trendline. 

The SHIB price has been in this slow, grinding downtrend since the 2024 highs, and every time it tries to bounce, it hits that descending trendline and rolls over. But this time feels a little different.

What the SHIB Chart Is Showing

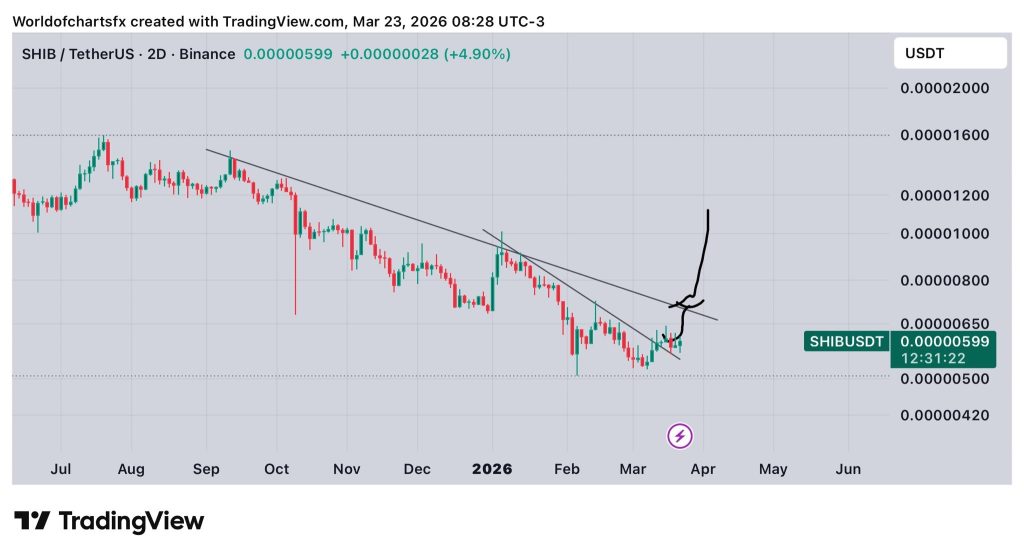
We took a look at the 2-day chart, and the structure is pretty clear. The SHIB price is currently sitting around $0.00000599, up about 4.9% on this candle. It’s been bouncing from the lows near $0.00000420 and working its way higher, and now it’s retesting an area that’s been a pivot point in the past.

Source: X/@Worldofcharts1

The descending trendline is the main event here. It’s been connecting the lower highs since the peak, and every time SHIB gets close, it gets rejected. World Of Charts is watching to see if this time is different. He’s expecting a move toward that trendline, which means we could see SHIB grind higher from here.

The chart shows the SHIB price has been forming a series of higher lows since the February bottom. That’s important because it means the downtrend might be losing steam. When you start seeing higher lows, it usually means sellers are getting exhausted and buyers are slowly stepping in.

What Retesting Means and The Levels That Matter

When an analyst says SHIB is “retesting,” it means the price is coming back to a level that’s been significant in the past. Sometimes it’s support. Sometimes it’s resistance. In this case, SHIB is retesting the area that previously acted as a launching pad for moves higher.

World Of Charts isn’t calling a moonshot here. What he’s saying is the next logical move is toward that descending trendline. That move would take SHIB from where it is now up to somewhere in the $0.000007 to $0.000008 range. That’s a 20%-30% move, which is actually pretty solid for a coin that’s been stuck in consolidation forever.

The level to watch is $0.00000550. If SHIB can hold above that, the path stays open. First stop is around $0.00000650, and then you’ve got the trendline itself, probably sitting somewhere in that $0.000007 to $0.000008 zone. Pretty simple roadmap. Now it’s just about whether SHIB can actually follow it.

On the downside, if SHIB loses $0.00000500, the setup changes. That would mean the higher lows pattern is broken, and we could be looking at a retest of the lows near $0.00000420. That’s not the expected move, but it’s the invalidation level to watch.

Read Also: ChatGPT Predicts the Price of XRP and Pi Coin By the End of 2026

What Comes Next for SHIB

SHIB is bouncing off support, making higher lows, and slowly working its way toward resistance. World Of Charts sees this as a retest, and he’s expecting a move toward the descending trendline.

That doesn’t mean it’s going to happen overnight. These things take time. But the structure is there. The pattern is clear. And if SHIB can finally break that descending trendline, that’s when things could get really interesting. 

Subscribe to our YouTube channel for daily crypto updates, market insights, and expert analysis.

The post Is Shiba Inu (SHIB) About to Break Its Months-Long Downtrend? The Chart Shows What’s Next appeared first on CaptainAltcoin.

Market Opportunity
SHIBAINU Logo
SHIBAINU Price(SHIB)
$0.000006094
$0.000006094$0.000006094
+0.32%
USD
SHIBAINU (SHIB) Live Price Chart
Disclaimer: The articles reposted on this site are sourced from public platforms and are provided for informational purposes only. They do not necessarily reflect the views of MEXC. All rights remain with the original authors. If you believe any content infringes on third-party rights, please contact [email protected] for removal. MEXC makes no guarantees regarding the accuracy, completeness, or timeliness of the content and is not responsible for any actions taken based on the information provided. The content does not constitute financial, legal, or other professional advice, nor should it be considered a recommendation or endorsement by MEXC.

You May Also Like

From Early Trading Losses to Global Impact: Somesh’s Journey to Building an Int’l Trading Community

From Early Trading Losses to Global Impact: Somesh’s Journey to Building an Int’l Trading Community

When Somesh started trading at 19, he lost nearly everything in three weeks. Today, he’s one of the most-followed day traders in the world with over one million
Share
Techbullion2026/03/24 13:12
Ethereum koers toont zeldzaam dubbel koopsignaal en richt zich op $4.550

Ethereum koers toont zeldzaam dubbel koopsignaal en richt zich op $4.550

Connect met Like-minded Crypto Enthusiasts! Connect op Discord! Check onze Discord   Ethereum laat op de uurgrafiek twee opeenvolgende TD Sequential koopsignalen zien. Deze indicator meet uitputting in een trend en geeft vaak een signaal dat de verkoopdruk kan afnemen. Dit dubbele signaal verschijnt rond het niveau van $4.516, waar de ETH prijs kortstondig steun vindt. Dit type formatie komt zelden voor en wordt daarom extra nauwlettend gevolgd. Wat gaat de Ethereum koers hiermee doen? Ethereum koers test steun rond $4.516 De scherpe daling van de Ethereum koers vanaf de prijszone rond $4.800 bracht de ETH prijs in korte tijd naar ongeveer $4.516. Op dit niveau trad duidelijke koopactiviteit op, waardoor de neerwaartse beweging tijdelijk werd gestopt. Het dubbele signaal dat door de TD Sequential indicator is gegenereerd, viel precies samen met dit prijspunt. De TD Sequential is opgebouwd uit negen candles die een trend meetellen. Wanneer de negende candle verschijnt, kan dit duiden op een trendomslag. In dit geval verschenen zelfs twee signalen kort na elkaar, wat aangeeft dat de verkoopdruk mogelijk uitgeput is. Het feit dat dit gebeurde in een zone waar ETH kopers actief bleven, maakt het patroon extra opvallend. TD Sequential just flashed two buy signals for Ethereum $ETH! pic.twitter.com/JPO8EhiEPi — Ali (@ali_charts) September 16, 2025 Welke crypto nu kopen?Lees onze uitgebreide gids en leer welke crypto nu kopen verstandig kan zijn! Welke crypto nu kopen? Fed-voorzitter Jerome Powell heeft aangekondigd dat de rentes binnenkort zomaar eens omlaag zouden kunnen gaan, en tegelijkertijd blijft BlackRock volop crypto kopen, en dus lijkt de markt klaar om te gaan stijgen. Eén vraag komt telkens terug: welke crypto moet je nu kopen? In dit artikel bespreken we de munten die… Continue reading Ethereum koers toont zeldzaam dubbel koopsignaal en richt zich op $4.550 document.addEventListener('DOMContentLoaded', function() { var screenWidth = window.innerWidth; var excerpts = document.querySelectorAll('.lees-ook-description'); excerpts.forEach(function(description) { var excerpt = description.getAttribute('data-description'); var wordLimit = screenWidth wordLimit) { var trimmedDescription = excerpt.split(' ').slice(0, wordLimit).join(' ') + '...'; description.textContent = trimmedDescription; } }); }); Technische indicatoren schetsen herstelkans voor ETH Naast de dubbele koopsignalen verstrekken ook andere indicatoren belangrijke aanwijzingen. Tijdens de daling van de ETH koers waren grote rode candles zichtbaar, maar na de test van $4.516 stabiliseerde de Ethereum koers. Dit wijst op een mogelijke verschuiving in het evenwicht tussen de bears en bulls. Als deze opwaartse beweging doorzet, liggen de eerste weerstanden rond $4.550. Daarboven wacht een sterkere zone rond $4.650. Deze niveaus zijn in eerdere Ethereum sessies al meerdere keren getest. Een doorbraak zou ruimte openen richting de all-time high van ETH rond $4.953. Wanneer de prijs toch opnieuw onder $4.516 zakt, liggen er zones rond $4.500 en $4.450 waar grotere kooporders worden verwacht. Deze niveaus kunnen als een vangnet fungeren, mocht de druk opnieuw toenemen. Marktdynamiek bevestigt technische indicatoren De huidige situatie volgt op een bredere correctie in de cryptomarkt. Verschillende vooraanstaande crypto tokens zagen scherpe koersdalingen, waarna traders op zoek gingen naar signalen voor een mogelijke ommekeer. Dat juist Ethereum nu een dubbel TD Sequential signaal toont, versterkt de interesse in dit scenario. Fundamenteel blijft Ethereum sterk. Het aantal ETH tokens dat via staking is vastgezet, blijft groeien. Dat verkleint de vrije circulatie en vermindert verkoopdruk. Tegelijk blijft het netwerk intensief gebruikt voor DeFi, NFT’s en stablecoins. Deze activiteiten zorgen voor een stabiele vraag naar ETH, ook wanneer de prijs tijdelijk onder druk staat. Fundamentele drijfveren achter de Ethereum koers De Ethereum koers wordt echter niet alleen bepaald door candles en patronen, maar ook door bredere factoren. Een stijgend percentage van de totale ETH supply staat vast in staking contracten. Hierdoor neemt de liquiditeit op exchanges af. Dit kan prijsschommelingen versterken wanneer er plotseling meer koopdruk ontstaat. Daarnaast is Ethereum nog steeds het grootste smart contract platform. Nieuwe standaarden zoals ERC-8004 en ontwikkelingen rond layer-2 oplossingen houden de activiteit hoog. Deze technologische vooruitgang kan de waardepropositie ondersteunen en zo indirect bijdragen aan een ETH prijsherstel. Het belang van de korte termijn dynamiek De komende handelsdagen zullen duidelijk maken of de bulls genoeg kracht hebben om door de weerstandszone rond $4.550 te breken. Voor de bears ligt de focus juist op het verdedigen van de prijsregio rond $4.516. De whales, die met grote handelsorders opereren, kunnen hierin een beslissende rol spelen. Het dubbele TD Sequential signaal blijft hoe dan ook een zeldzame gebeurtenis. Voor cryptoanalisten vormt het een objectief aanknopingspunt om de kracht van de huidige Ethereum trend te toetsen. Vooruitblik op de ETH koers Ethereum liet twee opeenvolgende TD Sequential signalen zien op de uurgrafiek, iets wat zelden voorkomt. Deze formatie viel samen met steun rond $4.516, waar de bulls actief werden. Als de Ethereum koers boven dit niveau blijft, kan er ruimte ontstaan richting $4.550 en mogelijk $4.650. Zakt de prijs toch opnieuw onder $4.516, dan komen $4.500 en $4.450 in beeld als nieuwe steunzones. De combinatie van zeldzame indicatoren en een sterke fundamentele basis maakt Ethereum interessant voor zowel technische als fundamentele analyses. Of de bulls het momentum echt kunnen overnemen, zal blijken zodra de Ethereum koers de eerstvolgende weerstanden opnieuw test. Koop je crypto via Best Wallet Best wallet is een topklasse crypto wallet waarmee je anoniem crypto kan kopen. Met meer dan 60 chains gesupport kan je al je main crypto coins aanschaffen via Best Wallet. Best wallet - betrouwbare en anonieme wallet Best wallet - betrouwbare en anonieme wallet Meer dan 60 chains beschikbaar voor alle crypto Vroege toegang tot nieuwe projecten Hoge staking belongingen Lage transactiekosten Best wallet review Koop nu via Best Wallet Let op: cryptocurrency is een zeer volatiele en ongereguleerde investering. Doe je eigen onderzoek. Het bericht Ethereum koers toont zeldzaam dubbel koopsignaal en richt zich op $4.550 is geschreven door Dirk van Haaster en verscheen als eerst op Bitcoinmagazine.nl.
Share
Coinstats2025/09/17 23:31
USD/JPY Forecast: Critical Surge to 158.80 as Bulls Face Decisive 200-EMA Test

USD/JPY Forecast: Critical Surge to 158.80 as Bulls Face Decisive 200-EMA Test

BitcoinWorld USD/JPY Forecast: Critical Surge to 158.80 as Bulls Face Decisive 200-EMA Test TOKYO, May 2025 – The USD/JPY currency pair has surged decisively into
Share
bitcoinworld2026/03/24 13:05