

Solana (SOL) Faces Critical Test at $76 Support Level as Bears Target 22% Decline
Key Takeaways
- Solana has declined 3% on Wednesday, approaching critical support at the 50-day EMA positioned at $76.67
- ETF inflows for SOL plummeted to $1.67M on Tuesday, a significant decrease from Monday’s $8.36M
- Open Interest contracted 4% over the past 24 hours to $5.31 billion, indicating diminished trader engagement
- Technical analyst Ali Charts cautions that failure to break through the $79–$85 resistance zone could send SOL tumbling to $53
- Market participants Scient and Ryker are monitoring the $74–$77 range as a critical support area before any bullish continuation
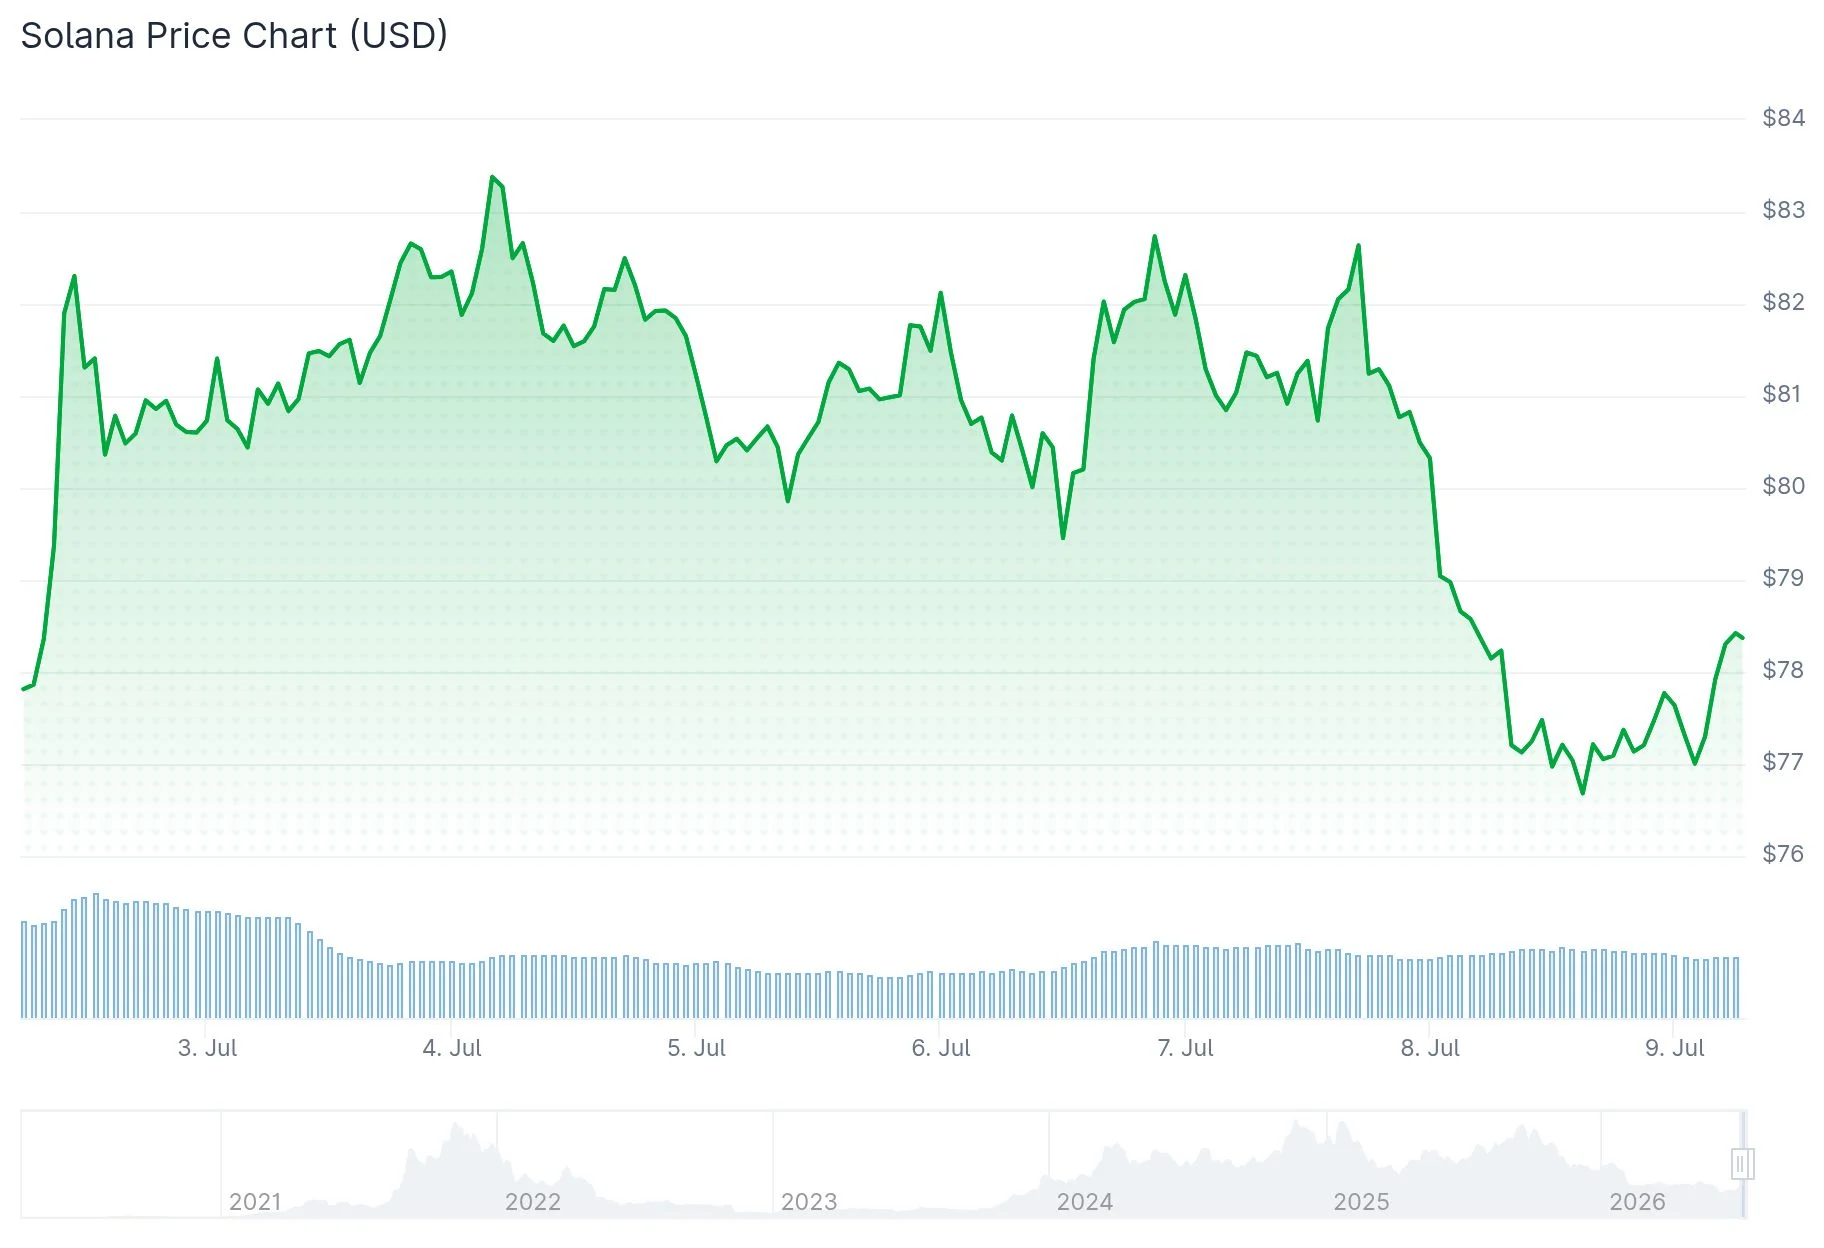
Solana (SOL) has posted a 3% loss on Wednesday, continuing a downward trajectory that initiated following a rejection at a long-standing overhead resistance trendline around $83.94.
 Solana (SOL) Price
This pullback has brought SOL perilously close to a crucial technical support area at $76.67, where the 50-day Exponential Moving Average (EMA) currently resides.
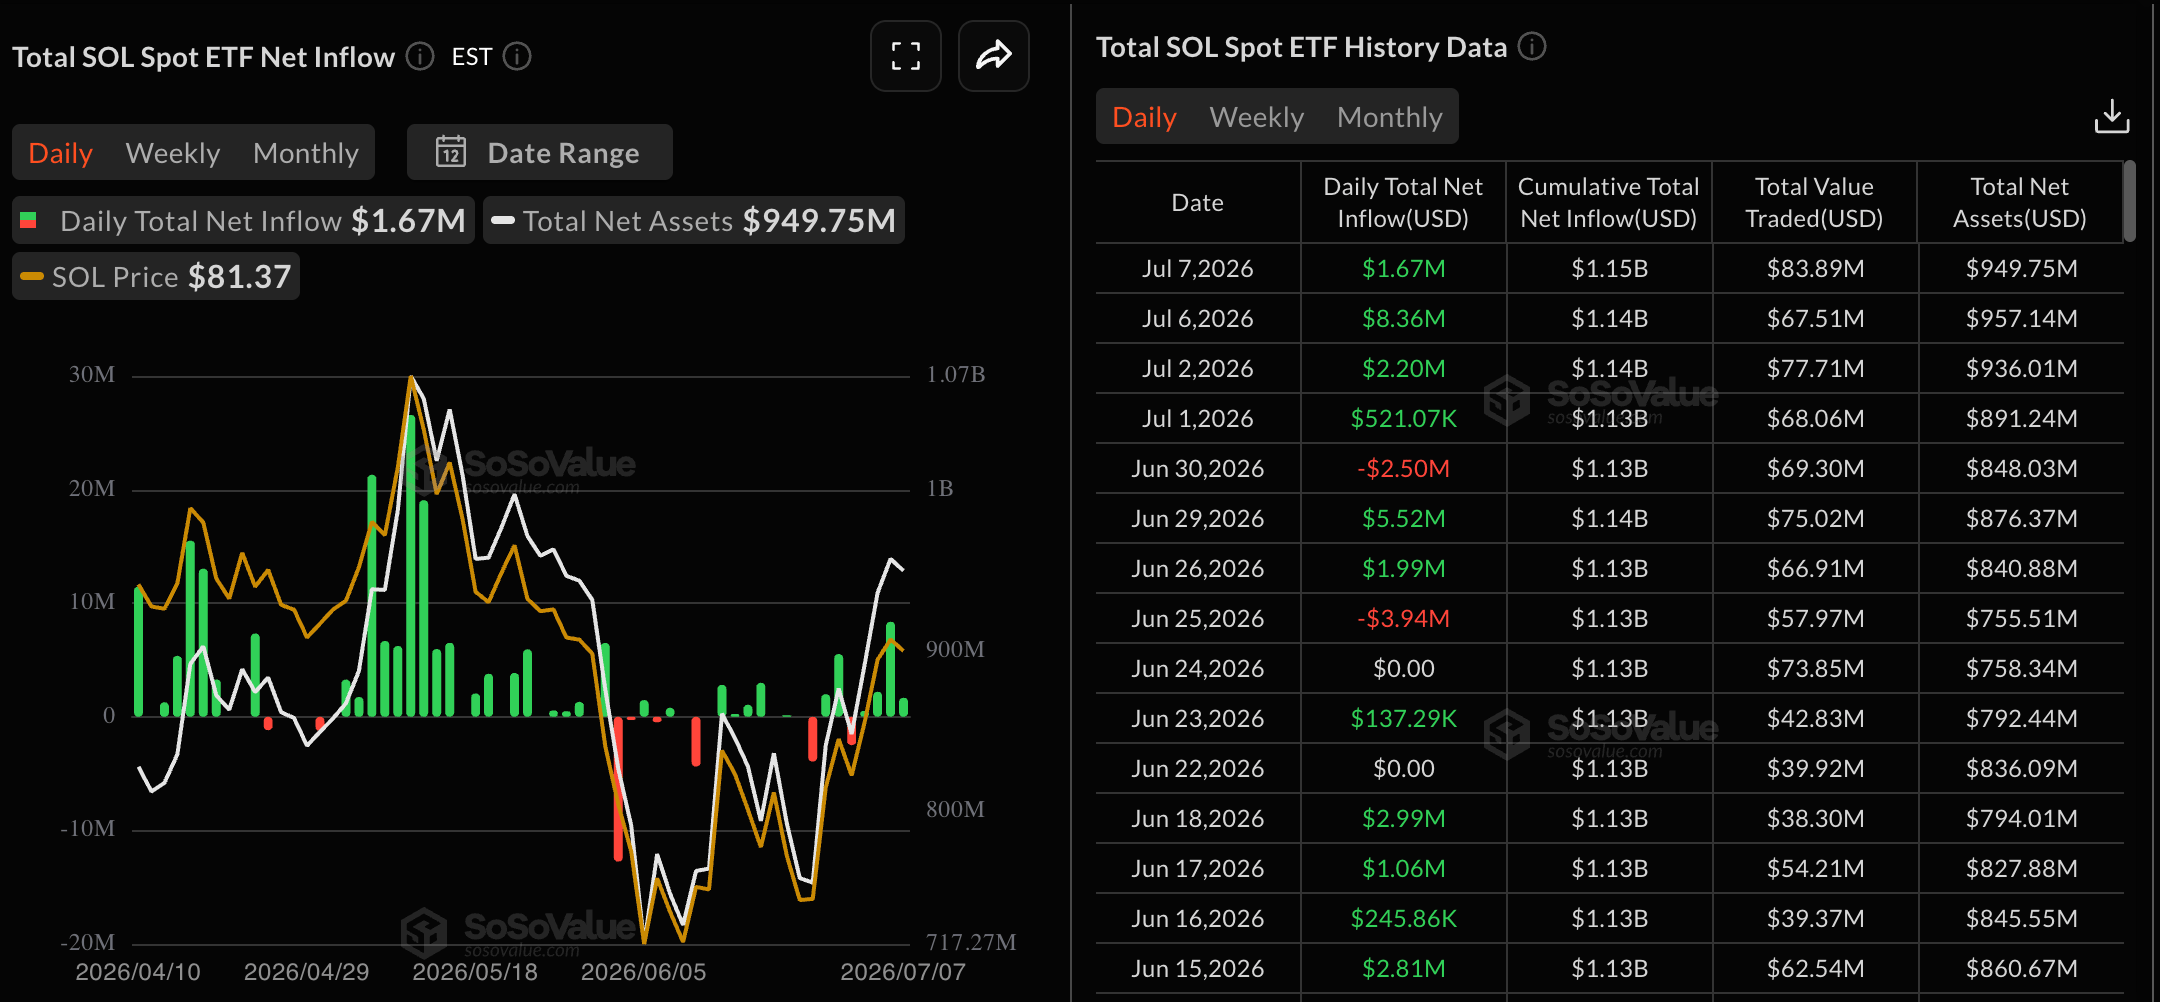
Institutional interest in SOL appears to be waning. ETF inflows registered just $1.67 million on Tuesday, representing a dramatic reduction from Monday’s $8.36 million, per Sosovalue tracking data.
 Source: SoSoValue
Futures Open Interest for SOL contracted 4% during the past 24 hours, settling at $5.31 billion according to CoinGlass metrics. Simultaneously, trading volume declined 8% to $8.66 billion.
Funding rates currently sit at 0.0029%, climbing from the previous day’s -0.0042%. This reversal suggests market indecision among traders rather than a definitive directional bias.
SOL continues trading significantly beneath the 200-day EMA at $95.51, keeping the overarching trend neutral instead of decisively bullish.
Bearish Momentum Builds Below $83.94 Resistance
The MACD indicator is trending downward toward its signal line, threatening a bearish crossover should buying interest continue deteriorating. Meanwhile, the RSI has retreated to 54, signaling weakening bullish momentum.
Immediate support rests at the 50-day EMA of $76.67, which aligns with the 50% Fibonacci retracement level at $76.92. A decisive close beneath this confluence zone could pave the way for a descent toward $60.13, representing approximately 22% downside.
Cryptocurrency analyst Ali Charts identified a substantial supply concentration between $79 and $85 in a post on X. Based on on-chain URPD analysis he presented, roughly 105 million SOL tokens changed hands within this price range.
He emphasized that successfully breaching this resistance cluster would clear the path toward $100 initially, followed by $127. However, rejection at these levels could intensify selling pressure, potentially driving SOL down to $53.
Market Participants Focus on $74–$77 Support Region
Trader Scient revealed he began accumulating his SOL position following the pullback into the $74–$77 area. He characterized this region as a previous breakout zone and positioned bids extending down to $74.
Should buyers successfully defend this support zone, the initial upside objective lies near $93. The broader target spectrum spans between $115 and $127.
Trader Ryker is drawing parallels between the current 2026 price action and Solana’s 2023 recovery pattern, when SOL established a base before launching a substantial rally. He acquired SOL at $40 during that cycle and exited at $122.
Ryker indicates he’s currently waiting for a more favorable entry opportunity before reentering positions. He suggests the current setup may require additional time to develop before the next significant upward movement materializes.
SOL ETF inflows on Tuesday totaled $1.67 million, marking the weakest performance in the past two days.
The post Solana (SOL) Faces Critical Test at $76 Support Level as Bears Target 22% Decline appeared first on Blockonomi.


You May Also Like

INTERPOL Fraud Bust Arrests 5,811 as Crypto Wallet Processes $122.5M
SpaceX Stock Hits All-Time Low as Morgan Stanley Sets $300 Target

Sony Bank stablecoin approval: $40M trust bank for PlayStation payments



